
Summary
- I identify KMB, GPC, SHEL, and VICI as undervalued dividend stocks with attractive yields and solid dividend histories.
- VICI stands out for its 6.85% yield and consistent dividend growth, prompting consideration for portfolio addition.
- I highlight CSCO as significantly overvalued, recommending profit-taking or exit, while NVDA is a compelling growth stock on dips.
- Applying P/E and EPS yield screens, I emphasize disciplined value investing and patience for optimal entry points.
- Rose’s Income Garden Portfolio of 72 stocks has a forward dividend yield of 6.15% and is up 6.24% YTD.
- This idea was discussed in more depth with members of my private investing community, Macro Trading Factory. Learn More »
- Sitewide Sale 2026: Get 20% Off
A normal P/E for most stocks is 15 with a growth stock being higher, much higher.
To be a great value it must have earnings growth higher than its own current P/E and also most likely an earnings per share/ EPS yield of over 6.6%, which is simply the inverse of the P/E. Growth stocks generally do not follow that rule.
This article will do 2 value evaluations. The first will be for common dividend stocks with yields over 2%. The second will be for low dividend growth stocks and reveal an extraordinary chart for overvaluation.
Evaluation #1 reveals 11 common stock candidates I found in my own Rose’s Income Garden/ RIG portfolio with EPS yield at 6.6% or above. They therefore have the potential to be undervalued and will be scrutinized in more depth in steps and reveal 4 winning candidates for purchase.
The charts used in the article use statistics from FAST Graphs, a paid subscriber service I use.
Evaluation #1
11 Common dividend stocks with EPS yield above 6.6%.
Without looking at dividends or yield which comes later, the chart below uses the following abbreviations:
Yield EPS = Earnings per share % yield
P/E Curr = Current P/E on June 19, 2026
P/E Normal = The average P/E over a longer range of years
P/E 10yr = P/E 10 years ago
To be a P/E undervaluation winner the current P/E should be lower than the others.
There are 7 winners of current P/E lower than normal or 10 yr. and are in bold print.
| Yield | Ticker | Name | P/E | P/E | P/E |
| EPS | Stock | Company | Curr | Normal | 10yr |
| 8.13 | (BTI | Brit Am Tobacco | 12.30 | 9.89 | 10.92 |
| 9.19 | (UGI | UGI Corp | 10.89 | 9.1 | 15.13 |
| 8.36 | (BCE | BCE Inc./ Canada | 11.96 | 12.7 | 15.2 |
| 11.53 | (BMY | Bristol Myers | 11.53 | 28.98 | 15.34 |
| 7.35 | (KMB | Kimberly Clark | 13.6 | 15.7 | 19.4 |
| 8.03 | (MO | Altria | 12.45 | 10.43 | 12.9 |
| 10.37 | (SHEL | Shell Plc | 9.64 | 10 | 13.51 |
| 10.64 | (VZ | Verizon | 9.40 | 8.68 | 10.78 |
| 6.94 | (GPC | Genuine Parts | 14.41 | 15.50 | 18.48 |
| 10.53 | (VICI | VICI | 9.5 | 11.09 | 16.46 |
| 10.88 | (ARCC | Ares Capital | 9.19 | 9.73 | 9.72 |
A deeper look at the above 7 involves a review of the 5 year dividend growth rate/ DGR and dividend payout %.
| Ticker | Name | 5yr | Pay |
| Stock | Company | DGR | Out |
| (BCE) | BCE Inc./ Canada | -2.35 | 102.50 |
| (BMY) | Bristol Myers | 6.65 | 40.30 |
| (KMB) | Kimberly Clark | 3.36 | 66.40 |
| (SHEL) | Shell Plc | 13.60 | 45.5 |
| (GPC) | Genuine Parts | 5.50 | 55.50 |
| (VICI) | VICI | 7.43 | 73.40 |
| (ARCC) | Ares Capital | 3.87 | 95.50 |
A positive DGR, the higher the better and certainly not negative and a low Pay Out are winning characteristics.
Only 1 company, BCE, shows a negative DGR and a very high payout which generally means it is struggling and the dividend that was cut in 2025 is still perhaps in jeopardy. The list is now down to 6.
Dividends, dividend yield and stock price.
The next chart shows yearly known or possible forward dividend and yield along with 52 week high and low price.
Current price is June 19, 2026.
Note all of the 6 have high yield being very close to 4% and higher.
| Ticker | E Div | Div | $Pr/Sh | 52 wk | 52 wk |
| Stock | 2026 | % Yield | Current | Lo | Hi |
| BMY | 2.52 | 4.67% | 54.00 | $42.52 | $62.89 |
| KMB | 5.16 | 5.03% | 102.56 | $92.42 | $137.46 |
| SHEL | 3.12 | 3.96% | 78.81 | $67.25 | $94.90 |
| GPC | 4.25 | 3.91% | 108.70 | $90.78 | $151.57 |
| VICI | 1.80 | 6.85% | 26.28 | $26.27 | $34.01 |
| ARCC | 1.92 | 10.65% | 18.03 | $17.40 | $23.42 |
KMB, GPC, VICI and ARCC are closer to price lows than highs which also indicates value.
Looking at Chowder #
C# = current yield plus 5 year DGR to determine if the company is advancing and eligible for purchase.
| Ticker | Name | 5yr | Div | C | 2 yr |
| Stock | Company | DGR | % Yield | # | DGR |
| (BMY) | Bristol Myers | 6.65 | 4.67% | 11.32 | 4.28 |
| (KMB) | Kimberly Clark | 3.36 | 5.03% | 8.39 | 3.15 |
| (SHEL) | Shell Plc | 13.60 | 3.96% | 17.56 | 6.90 |
| (GPC) | Genuine Parts | 5.50 | 3.91% | 9.41 | 3.70 |
| (VICI) | VICI | 7.43 | 6.85% | 14.28 | 4.40 |
| (ARCC) | Ares Capital | 3.87 | 10.65% | 14.52 | 0.00 |
All companies are currently considered high yield as they are over 3.5% and would only need a C# of 8 to pass which they do using the 5yr DGR. Note the 2 year growth rates are slowing and should be watched closely in any further due diligence.
Review of future earnings are the next step and once again these are 1 year forward estimates from FAST Graphs.
| Forward 1 year | Ticker | Name |
| Est Earn % | Stock | Company |
| -3.86 | (BMY) | Bristol Myers |
| 2.71 | (KMB) | Kimberly Clark |
| 14.45 | (SHEL) | Shell Plc |
| 8.0 | (GPC) | Genuine Parts |
| 3.38 | (VICI) | VICI |
| -3.1 | (ARCC) | Ares Capital |
With negative estimated forward earnings BMY and ARCC are eliminated.
The 4 Final Winners
1- KMB -yield of 5%. It has mildly okay estimated future growth and is a dividend champion paying a rising dividend for 54 years.
2- GPC -yield of 3.9% with good growth and is also a dividend champion paying a rising dividend for 69 years.
3- SHEL – yield of 3.75% with excellent future growth rather over shadows it only paying 2 consecutive years of rising dividends. It is included but will need to be watched for the promise of future growth as suggested.
4- VICI -yield of 6.85% and good growth for a high yield REIT. It also is a dividend challenger paying a rising dividend for 8 years.
Rose Recommendation.
Holding them all but considering adding to VICI.
Evaluation #2
Growth Stocks with yield less than 2%
This is limited to a few owned currently in RIG.
I am including CSCO as it was once owned and is a good example for overvaluation.
| Yield | Ticker | Name | P/E | P/E | P/E | 5yr | Pay |
| EPS | Stock | Company | Curr | Normal | 10yr | DGR | Out |
| 4.39 | (MSFT | Microsoft | 22.78 | 37.2 | 29.0 | 10.24 | 23.70 |
| 3.87 | (V | Visa | 25.83 | 28.6 | 30.1 | 14.58 | 20.60 |
| 3.72 | (MA | Mastercard | 26.9 | 34.8 | 34.3 | 13.70 | 17.90 |
| 3.01 | (NVDA | Nividia | 33.28 | 40.1 | 44.3 | 26.00 | 0.80 |
| 3.53 | (CSCO | Cisco | 28.33 | 15.43 | 14.7 | 2.67 | 42.50 |
EPS Yield
None of the low yield growth stocks can truly be evaluated properly using EPS yield as they are all extremely low indicating price is much higher than earnings. So P/E alone should be used next.
All the examples actually have similar P/E values but only CSCO shows a divergence from former P/E values. The others are undervalued as they are under the normal value. Cisco is a great example of an overvaluation which is no surprise to me.
All except Cisco have a high 5yr DGR over 10% which is necessary for low yield dividend stocks. Some would say these are primarily owned for capital gains and worrying about dividend growth might be only a secondary desire.
Dividends, Yield and Stock Price
| Ticker | E Div | Div | $Pr/Sh | 52 wk | 52 wk |
| Stock | 2026 | % Yield | Current | Lo | Hi |
| MSFT | 3.64 | 0.93% | 391.95 | $356.28 | $555.45 |
| V | 2.68 | 0.81% | 331.43 | $293.89 | $359.66 |
| MA | 3.48 | 0.70% | 499.27 | $464.52 | $601.77 |
| NVDA | 1.00 | 0.48% | 209.05 | $142.03 | $236.54 |
| CSCO | 1.66 | 1.39% | 119.39 | $65.02 | $130.37 |
Overvaluation with Cisco is a prime example with a yield falling and now just 1.39%.
The normal P/E of 15.43 is gone and its now a whopping 28.5. That’s overvaluation on steroids.
The future earnings estimates are shown below.
| Ticker | Forward |
| Stock | Est Earn % |
| (MSFT) | 16.8 |
| (V) | 13.3 |
| (MA) | 17.8 |
| (NVDA) | 65.15 |
| (CSCO) | 7.17 |
There are actual 4 winners in the chart and I revealing the overvaluation of Cisco.
Good growth stocks need or should have growth rates over 15% as they don’t necessarily rely on dividends. Most of these are close to that with Nvidia being a darn right standout for future estimated earnings.
2 charts for the worst/ CSCO and the best/ NVDA that shows how they have grown over the last 5 years.
Cisco
5 year Seeking Alpha technical chart
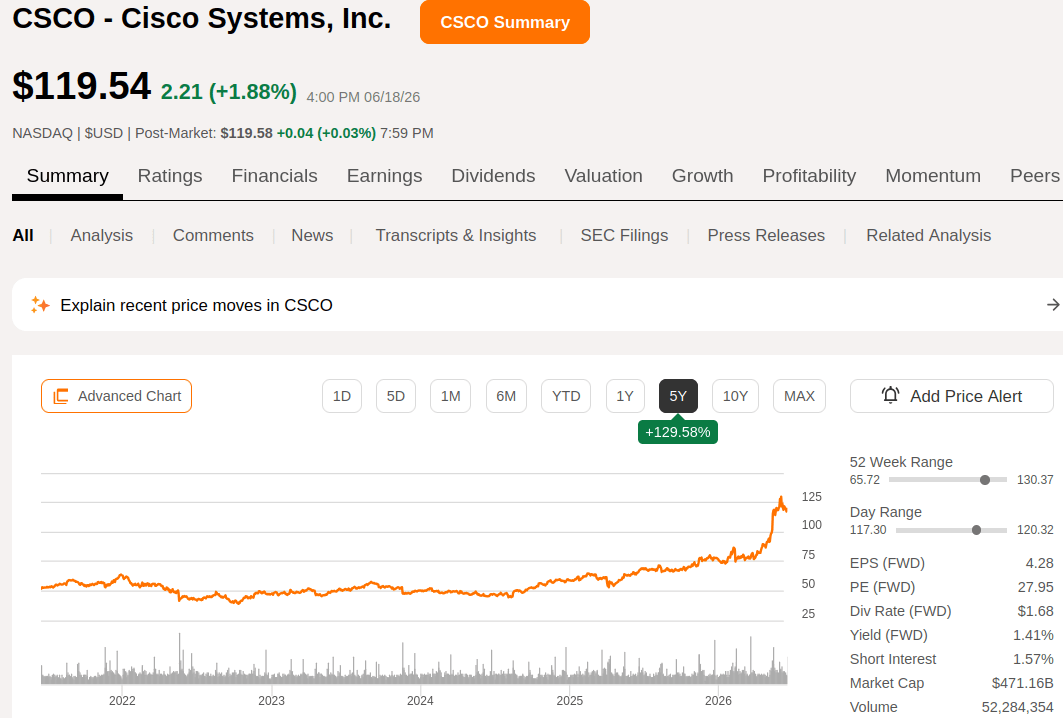
Yikes- Cisco did it all its price growth in about 1 year.
It certainly shows how overvalued it has gotten quickly. Cisco is and I would recommend to stay away. If you own it consider an exit, take profits and smile with the gains.
NVDA 5 year technical price chart
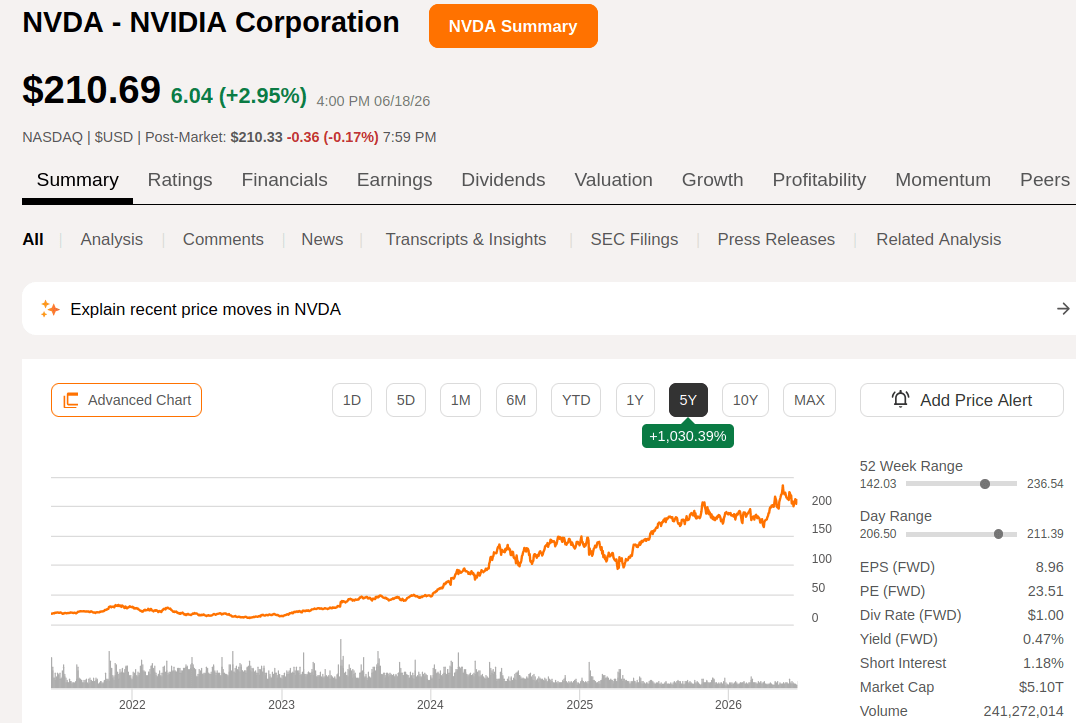
I own it, like it and will consider getting more on a dip as I am not exactly looking for growth stocks, but this one certainly has my attention.
Summary/ Conclusion
Using P/E generally works for evaluating most stocks and using further due diligence is recommended. Nothing wrong with wanting to own a great company but the hardest part is waiting for it to be a good value. I wanted a tech stock and had my sights set on Nvidia which is now owned and I admit I had to average down a bit not exceedingly so and remain pleased with owning it. I owned CSCO, did make gains when I sold but did not get to see the huge price gains now. Investing is not a perfect game and watching the price decline is a good lesson for patience especially when one knows the company was or is over valued. Time in years may fix prices eventually but knowing how to evaluate for value is advisable for successful investing. RIG is up 6.24% YTD and has a dividend yield of 6.15% so continued value investing remains a goal.