

Summary
- Investors in dividend-focused ETFs like SCHD point to past performance to justify their faith that their investments can weather any upcoming market conditions.
- This ignores three factors that can’t be evaluated through backtesting. Those factors are examined in detail. They are:
- The very short history of all dividend ETFs which does not extend to a period when inflation was even half of what it is now.
- The huge growth in popular dividend stock P/E multiples since 2011 when SCHD launched.
- ETF yields have never been significantly lower than the Fed Fund rate but that is on track to change. Fedspeak makes that very clear.
It would be an understatement to say that my recent article about the Schwab U.S. Dividend Equity ETF (NYSEARCA:SCHD) provoked a lot of reader feedback, most of it disagreeing with my premise that SCHD is going to struggle in a continuing inflationary environment.
One characteristic of most of the counter-arguments posted in the comments was that backtesting the historical performance of SCHD showed that it has outperformed through all kinds of markets, bull and bear, and held up well during recessions. Some comments asked why I had focused on SCHD and not other dividend ETFs like the Vanguard High Dividend Yield ETF (VYM) or the Vanguard Dividend Appreciation ETF (VIG) which they claimed had performed better in stressful times.
This argument is based on three glaring errors. Let’s look at them more closely.
Error #1: All These ETFs Have Short Histories That Don’t Include Truly Inflationary Times
None of these Dividend Growth ETFs or the mutual funds they are associated with have been trading for long enough to give us an accurate view of how well they perform in an inflationary environment. Below you can see the most popular dividend-focused ETFs with their inception year and the average inflation rate that prevailed during the year they were launched.
Inception Date and Inflation at Time of Inception
| NAME | TICKER | Inception Year | Inflation Rate at Inception |
| Vanguard Dividend Growth Fund | (VDIGX) | 2002 | 1.59% |
| Vanguard High Dividend Yield ETF | (VYM) | 2006 | 3.23% |
| Schwab U.S. Dividend Equity ETF | (SCHD) | 2011 | 3.16% |
| The iShares Core High Dividend ETF | (HDV) | 2011 | 3.16% |
| Vanguard Dividend Appreciation Index ETF | (VIG) | 2013 | 1.46% |
| ProShares S&P 500 Dividend Aristocrats ETF | (NOBL) | 2013 | 1.46% |
Note that 2011’s annual 3.16% inflation rate was a high that was not reached again until 2021.
Inflation Has Been Very Tame For The 30 Years Most Backtests Explore
The graph below shows you the annual inflation rates for the past 30 years, you can see that with only a brief spike in 2008 – which precipitated the Great Financial Crisis–average annual inflation has stayed below 3.25%. Often it has been below the 3% level that was exceeded by the yield of these dividend ETFs. (Graph provided by Macrotrends.)
Average U.S. Inflation Rate 1992 – 2021
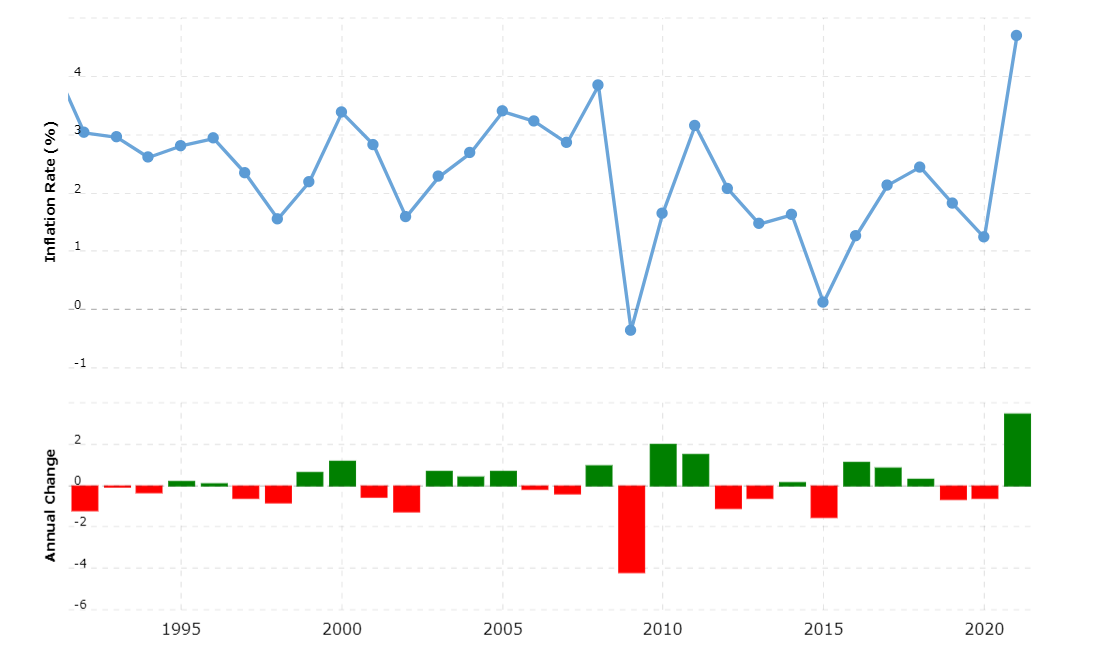
Inflation Now Is More Than Double Any Rates Seen In The Last 30 Years
Even after the CPI stayed flat in July (though the Core CPI, food, rent, and electricity costs did rise), the current U.S. inflation rate for the past 12 months now stands at 8.5%. Even if oil prices should drop dramatically, they are still far almost double what they were this time last year. Beyond oil, too, there are several other powerful factors driving inflation, including supply chain issues, China’s ongoing COVID-19 lockdowns, and the Russian Invasion of Ukraine with its harsh impact on European energy costs and global food demand.
So it is a mistake to think that the response of any of the Dividend ETFs to the relatively small and very short surges in inflation seen in past years is predictive of their future behavior. Their response so far to the inflation we are experiencing in 2022 does not predict much either, as it is very clear from how the market reacts to the slightest bit of news that investors are still expecting the Fed to step in and rescue the market just like it did in all the other recessionary periods the market has experienced since 2000.
What investors forget is that the Fed could do that because of how low inflation rates were in previous bear markets. Their mandate makes it impossible to ignore inflation rates now.
Error #2: Most Dividend ETFs Launched At A Time When Dividend Stocks Were Very Well Valued; They No Longer Are
As you can see from the table of Dividend ETFs above, dividend growth investing only became popular enough to spur the creation of a host of thematic ETFs after the first half of 2011, which not so coincidentally is when SCHD started trading.
But there is a reason so many popular Dividend ETFs started up in the years between 2011 and 2013: The valuation of dividend stocks back then. Back in those years, high-quality dividend stocks had very attractive Price/Earnings ratios. That is no longer the case.
The chart below shows you what the P/E ratios of the stocks that currently make up the top 10 holdings of SCHD were when SCHD launched in October of 2011 and what they are now. Note how much those P/E ratios have swelled, even after the recent bear market.
Valuations of SCHD’s Current Top 10 Stocks at Inception and Now
| Ticker | Name | P/E October 2011 | P/E Now | P/E Increase Since SCHD Inception |
| (TXN) | TEXAS INSTRUMENT INC | 14.68 | 27.73 | 88.90% |
| (PEP) | PEPSICO INC | 13.02 | 20.44 | 56.99% |
| (HD) | HOME DEPOT INC | 15.26 | 20.44 | 33.94% |
| (AMGN) | AMGEN INC | 10.28 | 14.64 | 42.41% |
| (KO) | COCA-COLA | 18.24 | 27.01 | 48.08% |
| (MRK) | MERCK & CO INC | 9.83 | 13.23 | 34.59% |
| (CSCO) | CISCO SYSTEMS INC | 10.53 | 13.93 | 32.29% |
| (AVGO) | BROADCOM INC | 12.46 | 15.74 | 26.32% |
| (PFE) | PFIZER INC | 8.31 | 8.80 | 5.90% |
| (IBM) | INTERNATIONAL BUSINESS MACHINES | 14.55 | 15.50 | 6.53% |
Source: P/E ratios from FAST Graphs using data from FactSet
The only two stocks in this list that have not seen their P/E ratios grow by an outsized amount are Pfizer (PFE) and IBM (IBM). Pfizer’s P/E ratio has stayed low because it lost patent protection for its blockbuster drug Lipitor in 2011 and has had a hard time coming up with any other drugs that could replace its lost revenue. Its earnings growth was almost flat until it came up with the COVID-19 vaccine demand for which is dropping. Hence its earnings are expected to decline for the next several years.
IBM’s share price was $176/share when SCHD launched in 2011. It has steadily declined to its current $136 level, decimating the capital invested by anyone who has bought it over this period. Yes, they got their dividends, but if they wanted to use their money they had invested in IBM to switch to another, better investment, they suffered a huge loss in buying power.
Investors today paying a lot more for a share of the high-quality dividend stocks that make up SCHD’s Top 10 and which are responsible for 40.85% of SCHD’s total value. These stocks are not priced at bargain prices. Their prices have shot up far faster than their earnings because with Fed rates near 0% until very recently, retirees had no other alternative to investing in dividend stocks if they wanted to draw income from their portfolios without touching their capital. Since July 2022, that tailwind for dividend stock prices has vanished.
Error #3: Dividend ETF Yields Have Been Far Higher Than The Treasury Rate Since 2008 But That Has Changed
From December of 2008 to May of 2017, the Fed Rate was near 0%. It only rose over 1% at the end of that period. It rose to 2.41% in February of 2019, only to begin declining again and to collapse back to 0% in April of 2020 due to COVID-19.
U.S. Federal Funds Effective Rate 2002 – Now
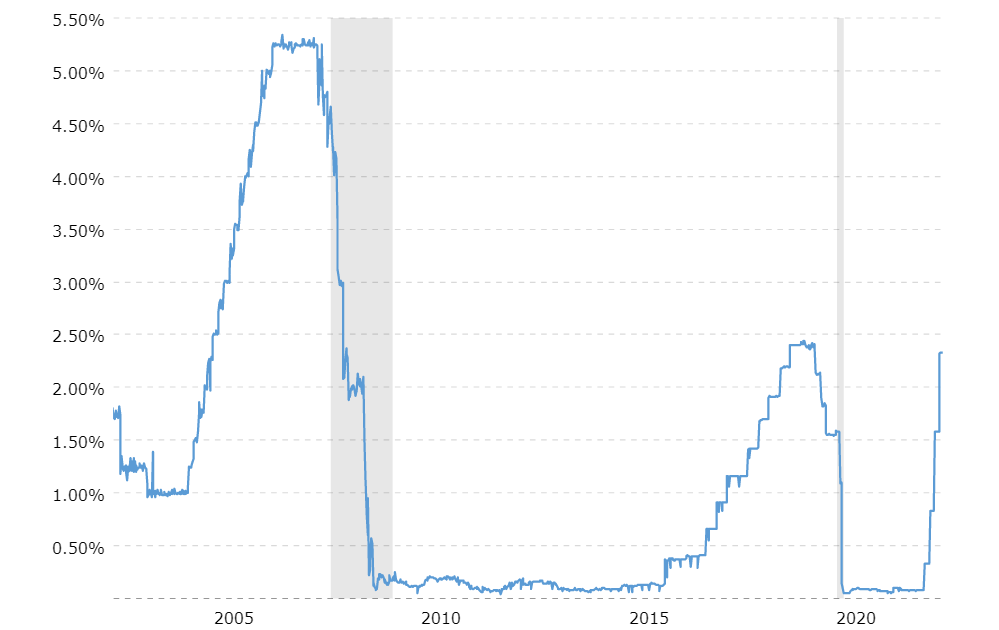
Investors are still assuming that any hint that a recession is starting will cause the Fed to drop its rate as it did in 2019. But look up at that chart of inflation over the same period. Inflation barely topped 2% at the time when the Fed had raised its rate to a level that was actually higher than inflation at the time.
With inflation now at 8.5%, even if it drops significantly over the next year, the Fed rate is nowhere near the rate of inflation we are experiencing and are likely to keep experiencing for at least another year or two. This gives the Fed no choice but to raise its rate.
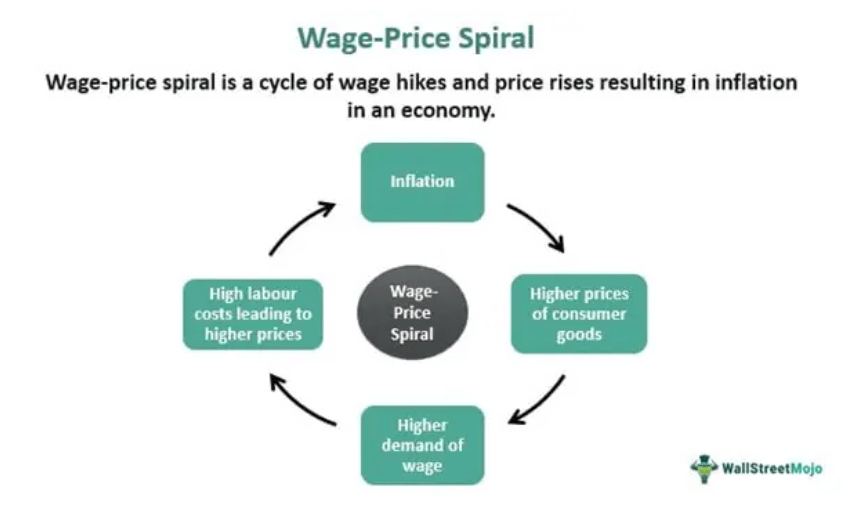
The alternative is to see the wage-price inflationary spiral continue to drive inflation upwards as it did in the 1970s. That spiral is well illustrated by the graphic below provided by wallstreetmojo.com.
The Fed Is Signaling It Will Continue To Raise Rates
The Fed has made it clear that it will keep raising rates. The only issue is by how much and for how long, but investors and trading algorithms distort the meaning of the Fed speakers’ words to hear what they want to hear.
There have been few speeches by Fed officials since the July 27, 2022 meeting where they raised the interest rate by .75% to the range of 2.25 – 2.50. But what we have heard doesn’t suggest that the Fed will stop raising rates. Case in point, this recent speech by Federal Reserve Governor Michelle Bowman.
Pay attention to the wording from her speech delivered on August 6, 2022.
Regardless of the source of the inflationary pressure, [emphasis mine] the Federal Reserve has a duty to bring inflation down to our 2 percent target. This duty is mandated by Congress to carry out monetary policy that results in price stability—meaning low and stable inflation. …
Some workers have seen their wages grow significantly over the past two years, but most have seen any gains in wages far outpaced by higher prices. Therefore, in my mind, it is absolutely critical that we continue to use our monetary policy tools until we are successful in returning inflation to our 2 percent goal. …
I supported the FOMC’s decision last week to raise the federal funds rate another 75 basis points. I also support the Committee’s view that “ongoing increases” would be appropriate at coming meetings. My view is that similarly-sized increases should be on the table until we see inflation declining in a consistent, meaningful, and lasting way. [emphasis mine]
The rest of the speech cites the sources of continuing inflation, which include the conflict in Ukraine’s impact on European energy prices and Chinese lockdowns.
If you look at the charts of the inflation rate and the Fed Funds rate, you will see that through 30 years of low inflation, until the beginning of QE in 2008, the Fed Funds rate was almost always slightly higher than the inflation rate. This kept inflation well in check. There is no reason to believe that the Fed will allow a gap of 6% between its target and that of annual inflation to persist. For that matter, even a gap of 3% as would happen if inflation dropped to “only” 5% would be a major concern.
Most recently, on Wednesday August 17, 2022, the market surged after the release of the July FOMC minutes because, as reported by Bloomberg,
Fed minutes noted it would eventually be appropriate to decelerate the pace of interest-rate increases. [emphasis mine]
For those not entirely familiar with the English language, it’s worth noting that “eventually” does not mean “soon” or “this year” or even “five years from now.” It just means “at some time in the future, probably after a long wait.” If your boss tells you you are going to get a raise “eventually,” it is not good news.
The Fed also made it clear that, as they always state, their future rate hikes would be “data-dependent.” So far, the data suggests that prices are still increasing albeit at a slower rate than prevailed a few months ago. The most recent July retail sales data released today shows that retail sales excluding autos rose .4%, which was considerably higher than the .1% analysts expected. This goes hand in hand with the Core CPI data for July which rose .3% driven by a rise in the price of electricity, shelter, and food, the latter of which increased 1.1% over the month. None of these figures suggest that inflation in the costs most worrisome to consumers is abating.
The Era Of TINA Is Over And There Are Safe Alternatives For Investors Seeking Income
Ever since the July 27 FOMC meeting where the Fed rate was increased to a range of 2.25% – 2.50%, retirees and other investors looking to generate income from their portfolios have been able to buy completely safe Treasury and short-term CDs that have yields competitive with the Dividend Growth ETFs and which don’t offer the possibility of seeing their principal decline over the next few years.
Brokered CDs and Treasury Rates – 8/17/2022 – Vanguard
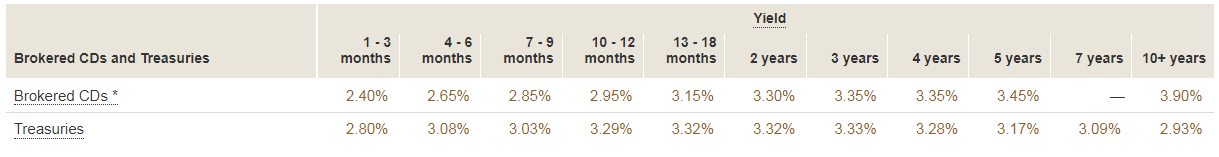
If the Fed raises its rate by just .50% at each of 2022’s three remaining meetings, it will rise to the range of 3.75% to 4.00%. When that happens, you can expect to see these rates, at least for the next 2 or 3 years, rise another 1.50%. This would make it possible to buy CDs and Treasury bills paying rates approaching 5.0%. Even Money Market Mutual Funds, whose rates closely track the Fed rate would see yields near 3.75%, too.
Contrast that yield with the current and estimated yields of the popular dividend ETFs.
Dividend ETF Yields
| Ticker | Name | Yield TTM | Yield FWD | 4 Yr Avg Yield |
| SCHD | Schwab U.S. Dividend Equity ETF | 3.12% | 3.62% | 3.02% |
| VDIGX | Vanguard Dividend Growth Fund | 1.51% | 2.32% | 5.32% |
| VYM | Vanguard High Dividend ETF | 2.90% | 3.08% | 3.11% |
| HDV | The iShares Core High Dividend ETF | 2.99% | 2.16% | 3.62% |
| VIG | Vanguard Dividend Appreciation Index ETF | 1.79% | 1.74% | 1.76% |
| NOBL | ProShares S&P 500 Dividend Aristocrats ETF | 1.88% | 1.63% | 2.07% |
| DGRO | iShares Core Dividend Growth ETF | 1.98% | 1.78% | 2.25% |
Source: Seeking Alpha Portfolio Dividend Feature
Your investment in these ETFs or the active fund, VDIGX, over the next few years will only be more profitable than a safe short-term fixed income investment if dividend stock prices continue to climb. But the desperate need for income which has driven that price surge until now is abating. Because the Dividend ETFs have never traded in a sustained period where safer Fixed Income rates were available, so backtesting those ETFs can possibly mislead you.
Bottom Line: Don’t Base Forward-Looking Income Investment Decisions On Backtests
The period over which the dividend ETFs have flourished was one of unprecedented low inflation and even lower interest rates. The market surged through this period no matter what was happening in the economy thanks to the availability of cheap money and the lack of other income alternatives for retirees needing to draw on their portfolios without diminishing them. Those days are over. The impact on dividend-focused ETFs of inflation-linked Fed rate increases has yet to be seen and won’t be evident until investors are rudely awakened from the dream that the Fed will always protect their stocks.
There are valid reasons for investing in best-of-breed individual dividend-paying stocks, especially when you can buy them when they are trading at reasonable valuations.
But ETFs are different from individual dividend-paying stocks. They are collections of lots of different dividend-paying stocks with all different kinds of valuations, many of which are currently priced for perfection. It is extremely hard to get a sense of how the many stocks in these ETFs will behave in an environment where credit is far more expensive and companies’ costs rise as fast as they can raise their own prices.
The Dividend ETFs’ past performance record is too short to give us any insight here. They have not ever traded during a period of inflation lasting more than a few months. They have never traded in a period where inflation exceeded 4%. And most of all, they have never traded in a market that wasn’t heavily supported by the Fed’s policy of keeping rates below the actual rate of inflation.
If you have owned these ETFs for a while and are getting a satisfying yield on your original investment, along with price appreciation that gives you a margin of safety for your original investment, there is no reason not to hold.
But for investors looking to deploy new funds into income-producing securities, fixed income may be a much safer, equally rewarding investment over the next year or two. Only when dividend stocks’ valuations return to the kinds of levels that made them appealing in 2011 would it make sense to invest in them again.
—-
Notes
* Before 2011, the emphasis of Dividend-focused funds wasn’t the dividend. Active mutual fund VDIGX which began trading as the earliest dividend growth mutual fund in 2002, taking over the ticker of the old Vanguard Dividend Income Fund, dividend growth as a marker for quality. Its goal was not income generation but to improve total return.
VYM which began trading in 2006 sounds like it invests in stocks with high dividends, but its methodology, the sub-2% yields of many of its holdings, and the fact that it holds 443 stocks make it questionable whether it is really a high dividend ETF rather than a “not growth” ETF.
Photo by engin akyurt on Unsplash