

Summary
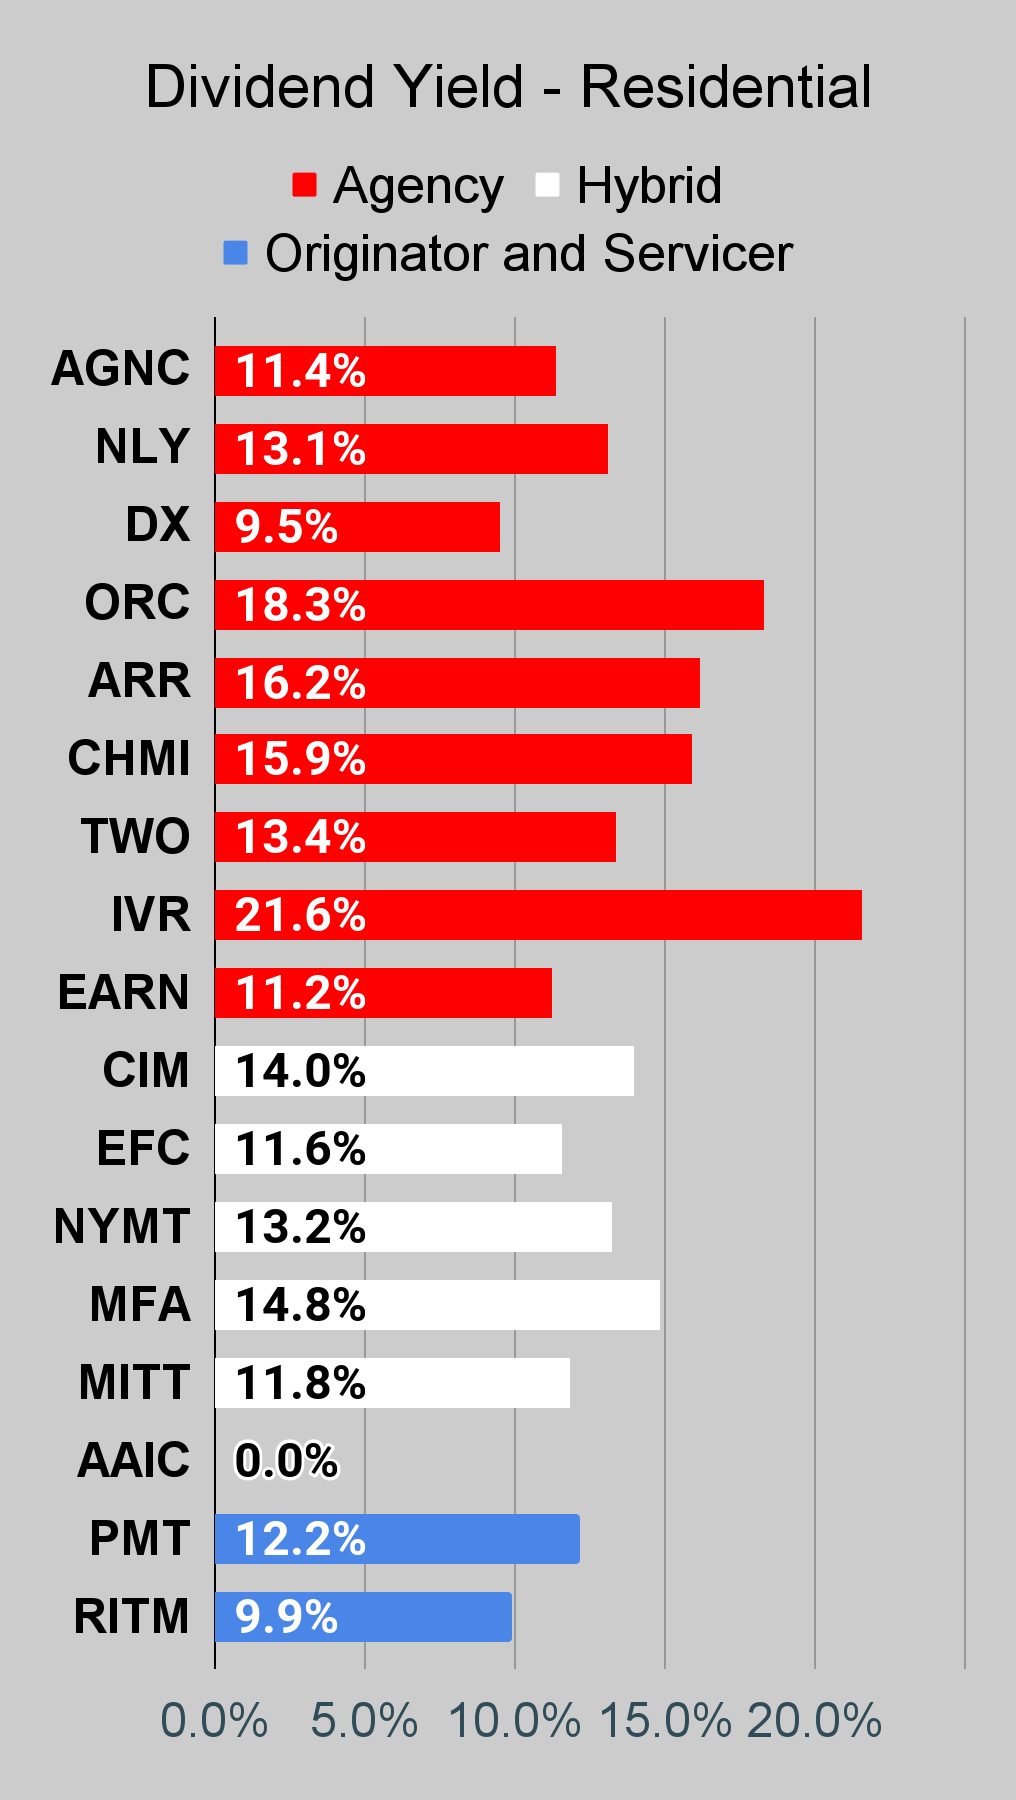
- 18% Yield? Whacked to 13%. Notice a trend?
- Read my stuff? You saw it coming. Some peers will still be looking to chop their dividends as well. Why do so many people buy blindly while claiming to invest?
- Investors might close out their shorts now for a quick 10%, but “buying to close a short” is the only kind of reasonable buying. This still isn’t a bargain.
- Want to retire? Don’t buy an 18% yield. You’re just buying a dividend cut.
- How about 5 alternatives? Sure, I’ll toss in 5.
- Looking for a portfolio of ideas like this one? Members of The REIT Forum get exclusive access to our model portfolio.
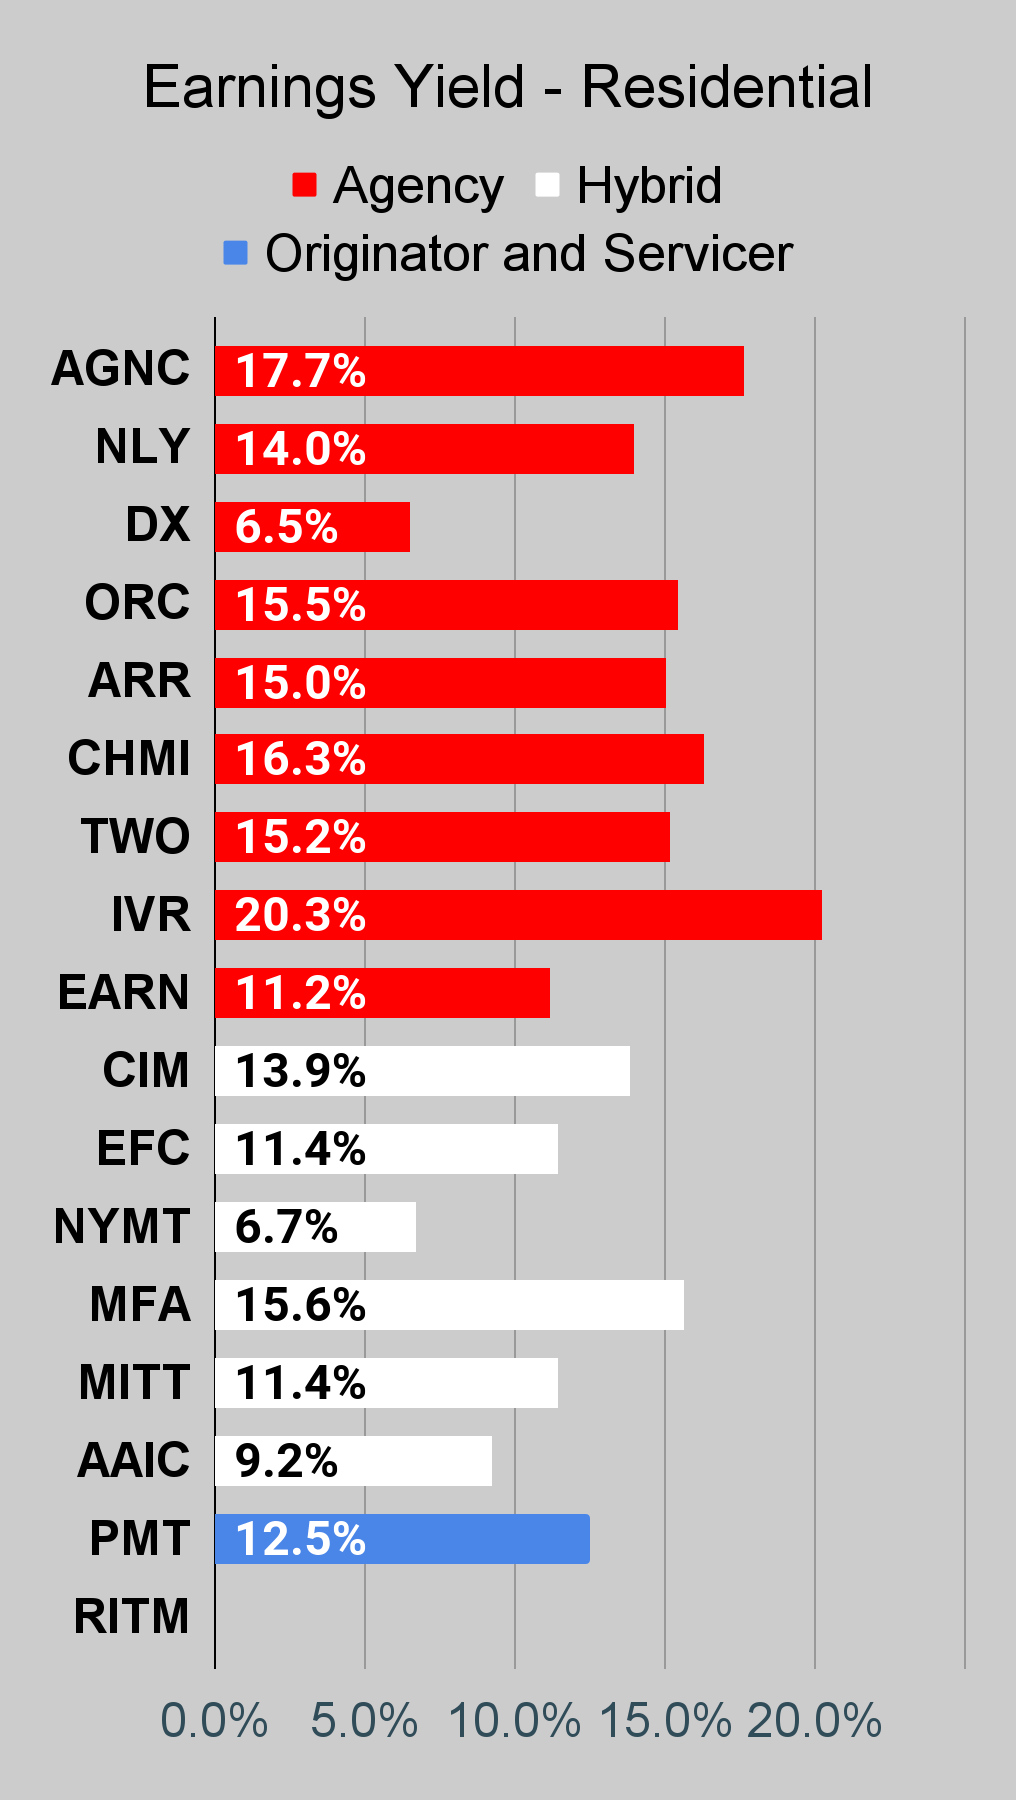
Chop, chop, chop the dividend! That’s what an orcish lumberjack does. They don’t care about trees; they just chop dividends. Of course, I’m really talking about Orchid Island Capital (ORC).
The amount a REIT paid out in dividends for the prior quarter doesn’t tell you how much a share is worth. That’s simply not how investing works. No, it’s not. If you buy a sucker yield, that’s on you. It’s not on the board that reduced an obviously unsustainable dividend. It’s on the investor who looked at the dividend yield and declared themselves the next Warren Buffett for coming up with an investing technique no other person had ever considered before. That sarcasm coming through clearly enough? You never know on the internet.
ORC demonstrated the wisdom of those words by chopping the dividend. Nearly 30% of that monthly dividend is already gone.
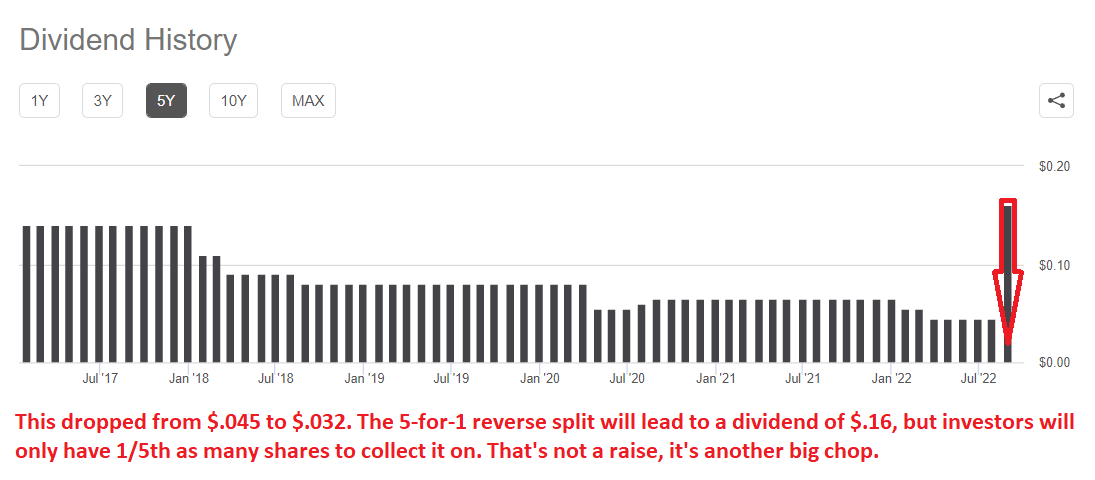
Did you notice a trend in the chart? Something like “down and to the right”?
It wasn’t the first time I suggested selling ORC. Or the second. Or the third. Look, I’m not going to count how many times we’ve suggested it because that because that would get really boring. I’ll just remind you that I also recommended it on August 1st, 2022 in:
3 High Yielders to Dump After an Epic Rally
The three highlighted were ORC, ARR, and NLY.
Was a bearish rating on ORC for August 1st a good idea?
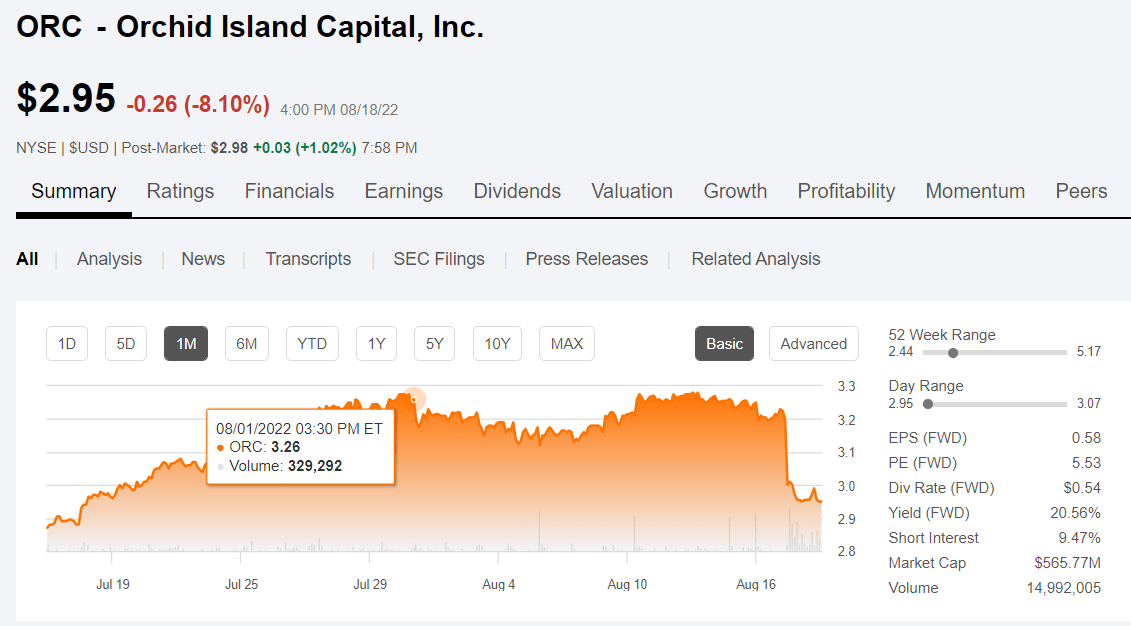
Sure, anytime something announces a dividend cut and is down about 10% from in a few weeks it was probably a good bearish rating.
Is ORC finally a coiled spring ready to shoot to the moon? No. I really don’t think anyone reads my articles and wondered about that. On the plus side, they aren’t so terrible now. Not a good deal, but part of the edge came off. Investors who hopped on the opportunity to short ORC might take their quick 10% and buy another security.
Will there be any other dividend cuts? Probably. Am I going to highlight all of them right now in a public article? No.
There are still a few that simply look too high. Is the market being intelligent about those risks? No. Being intelligent would mean prices falling before the cut is announced, rather than being shocked when the board makes the obvious decision. *Surprised Pikachu Face*. Sorry, no memes allowed directly in the article.
We can still see dividend yield impacting valuations as some investors hop in to support the share price so they can pretend they’ll get paid the same dividend in the future. Want to retire? Don’t do that.
Pretend dividends are only good for buying pretend food and pretend shelter.
Some Alternatives
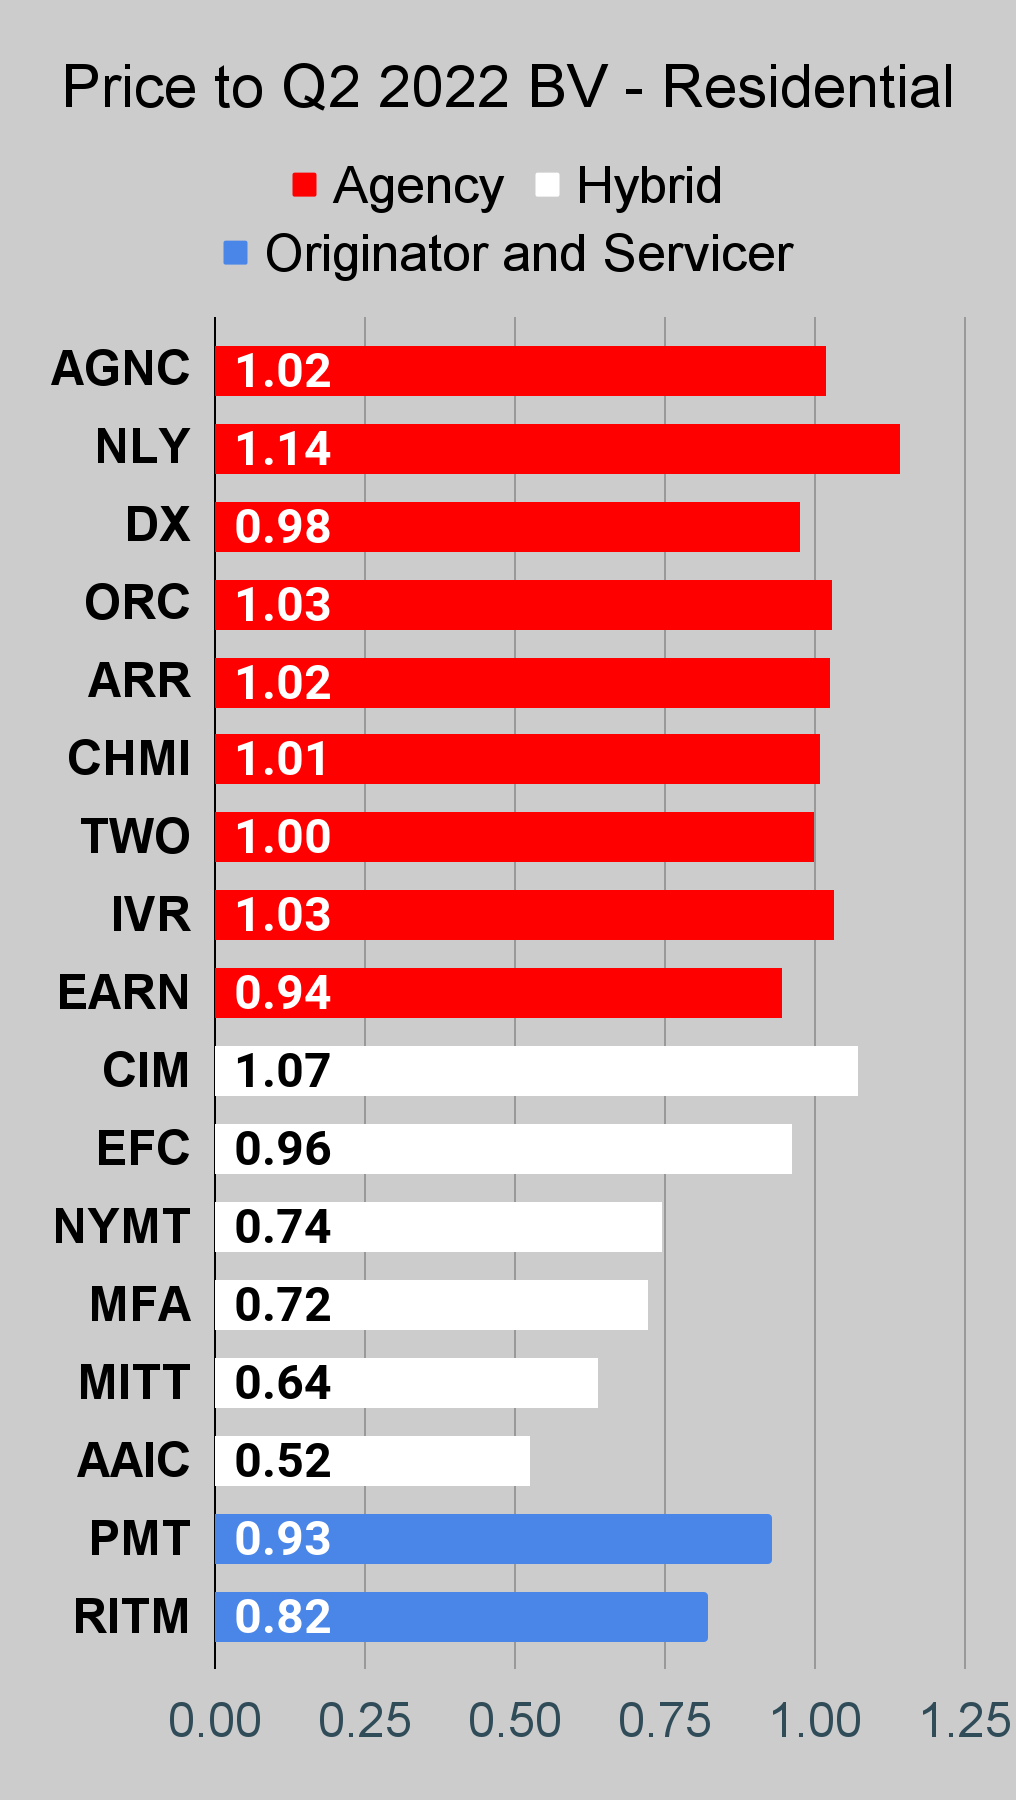
What could investors buy instead? How about Rithm Capital Corp. (RITM). Formerly known by the better name of New Residential, RITM has dramatically better dividend coverage and a better (that means lower) price-to-book ratio.
I previously suggested DX as another alternative. Believe it or not, even after ORC got slapped down for 8% in a day DX is still offering a better value. Yes, the dividend yield is still “lower,” but DX comes with a better history of decision making.
If there is one lesson investors in this sector need to realize, it is that book value drives dividends. Investors who disregard book value are ignoring the amount of equity management has available to leverage into the model. That’s why protecting book value is so important. Leverage can’t go up to infinity. When book value gets wrecked, mortgage REITs need to reduce their assets to get leverage back under control. That means selling assets at the wrong time. Bad idea.
What could they do? Use less leverage, especially when the deck is stacked against them. That’s not a popular strategy though, because several investors are busy staring at the highest yields in the sector. The ones that are lined up for the lumberjack to chop, chop, chop away.
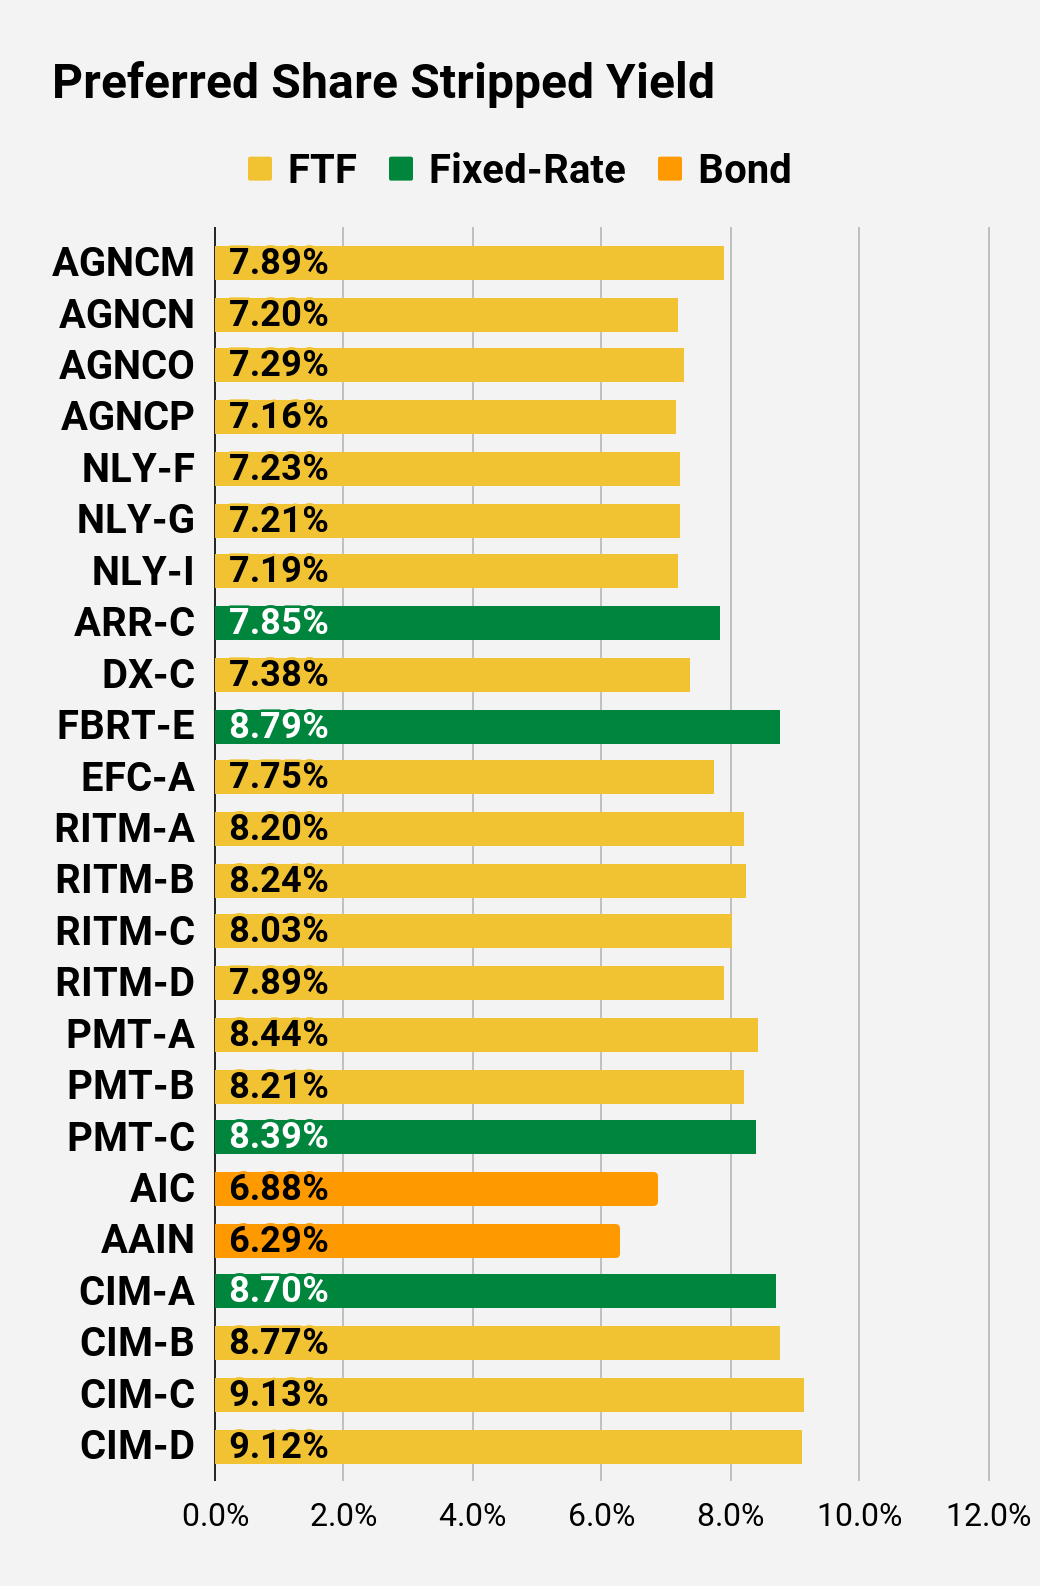
Want more safety in your dividends? Check the preferred shares. AGNCM, AGNCO, and AGNCP are each offering attractive yields in the 7.15% to 7.9% range and all 3 are set to increase their dividends when the floating rates kick in. That depends on the future path of short-term interest rates, but if you’re expecting rates to go lower there are plenty of great choices for fixed-rate dividends. I went over a few of them yesterday, so we can skip it this time.
That’s 5 different shares in bold. Check them out and see what you think. Any of them still offers a better risk/reward profile.
The rest of the charts in this article may be self-explanatory to some investors. However, if you’d like to know more about them, you’re encouraged to see our notes for the series.
Stock Table
We will close out the rest of the article with the tables and charts we provide for readers to help them track the sector for both common shares and preferred shares.
We’re including a quick table for the common shares that will be shown in our tables:
| Type of REIT or BDC | ||||
| Residential Agency | Residential Hybrid | Residential Originator and Servicer | Commercial | BDC |
| AGNC | CIM | PMT | BXMT | MAIN |
| NLY | EFC | RITM | GPMT | TSLX |
| DX | NYMT | WMC | NEWT | |
| ORC | MFA | RC | ARCC | |
| ARR | MITT | GAIN | ||
| CHMI | GBDC | |||
| TWO | SLRC | |||
| IVR | ORCC | |||
| AAIC | TCPC | |||
| EARN | PFLT | |||
| OCSL | ||||
| AINV / MFIC | ||||
| FSK | ||||
| PSEC |
18.3% is more like 13%. Ouch.
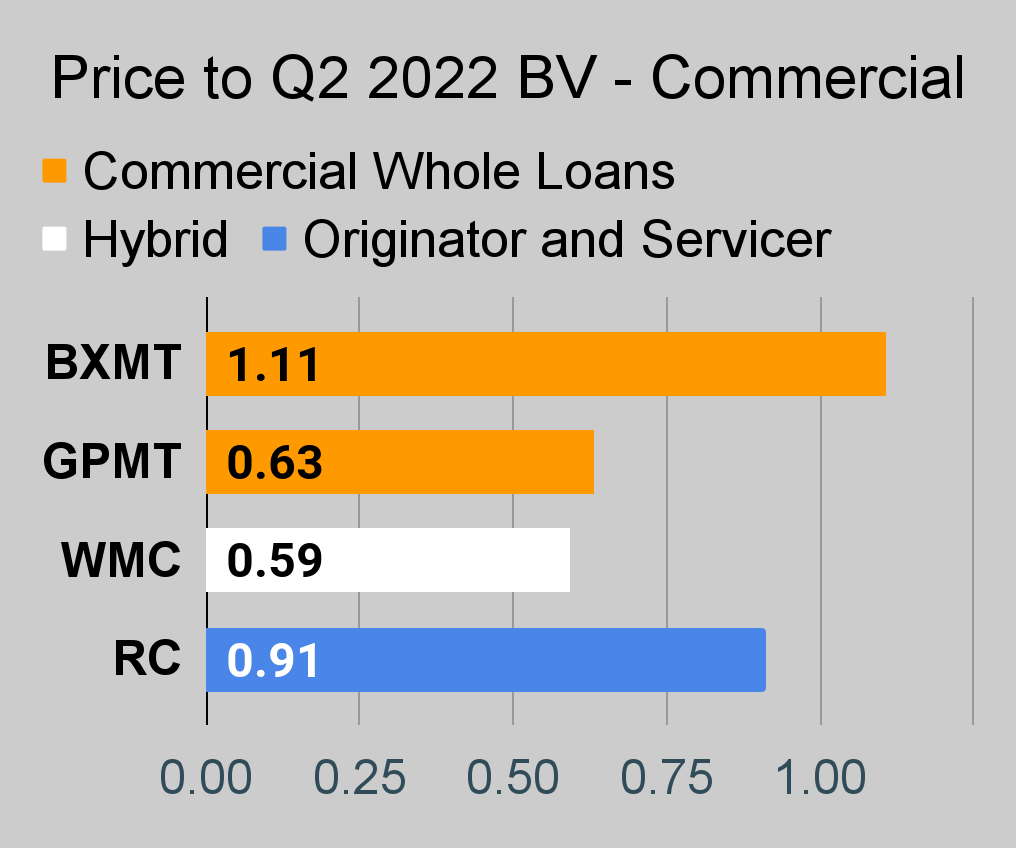
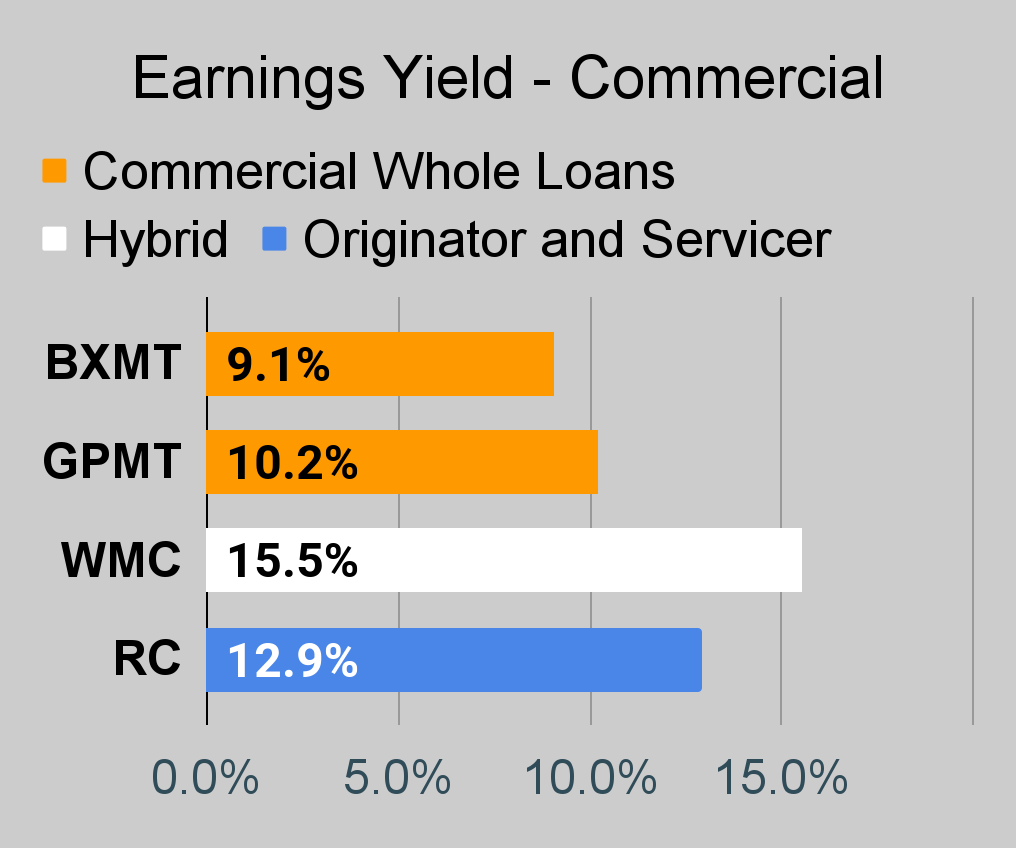
Commercial Mortgage REIT Charts
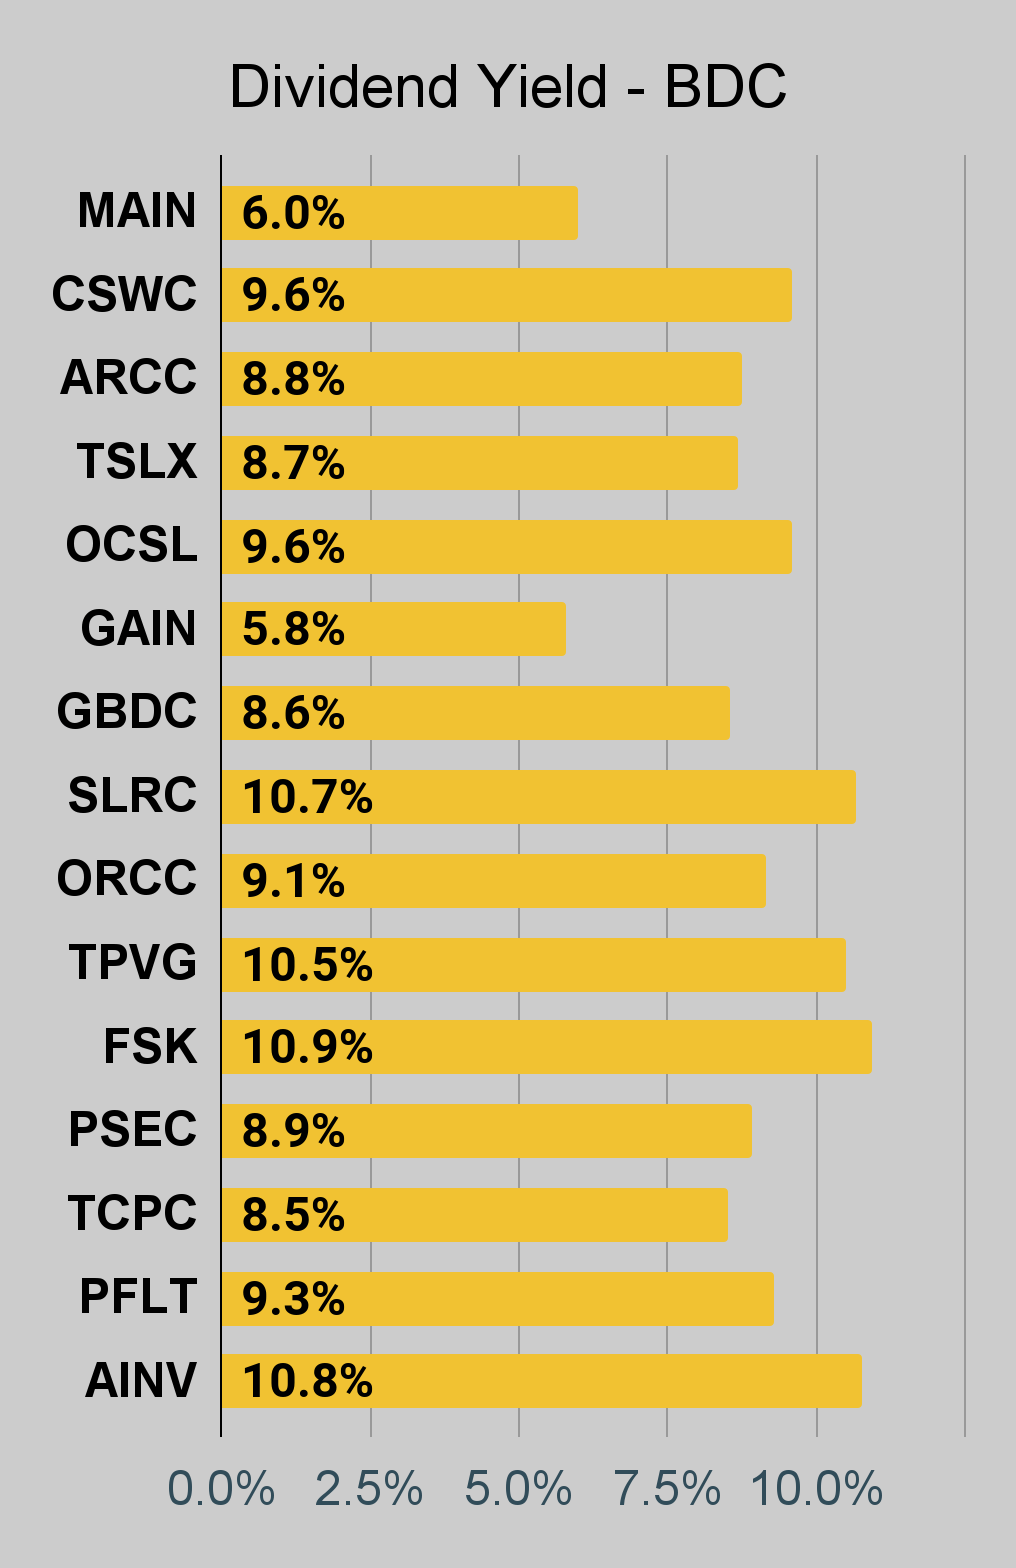
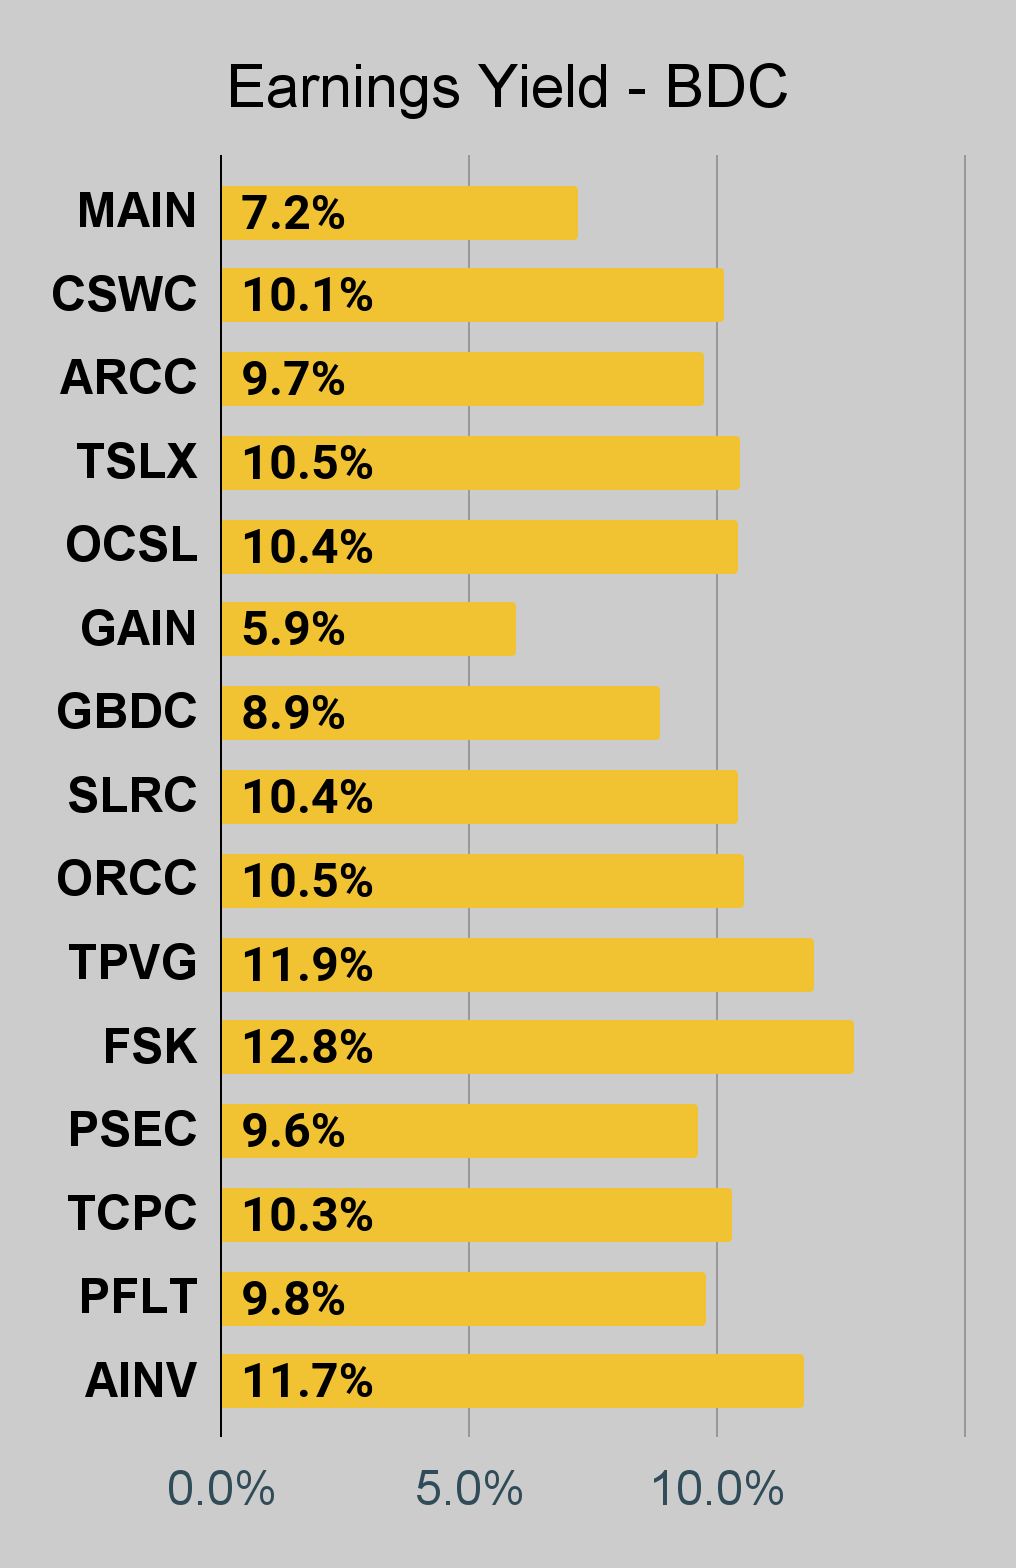
BDC Charts
Preferred Share Charts
Preferred Share Data
Beyond the charts, we’re also providing our readers with access to several other metrics for the preferred shares.
After testing out a series on preferred shares, we decided to try merging it into the series on common shares. After all, we are still talking about positions in mortgage REITs. We don’t have any desire to cover preferred shares without cumulative dividends, so any preferred shares you see in our column will have cumulative dividends. You can verify that by using Quantum Online. We’ve included the links in the table below.
To better organize the table, we needed to abbreviate column names as follows:
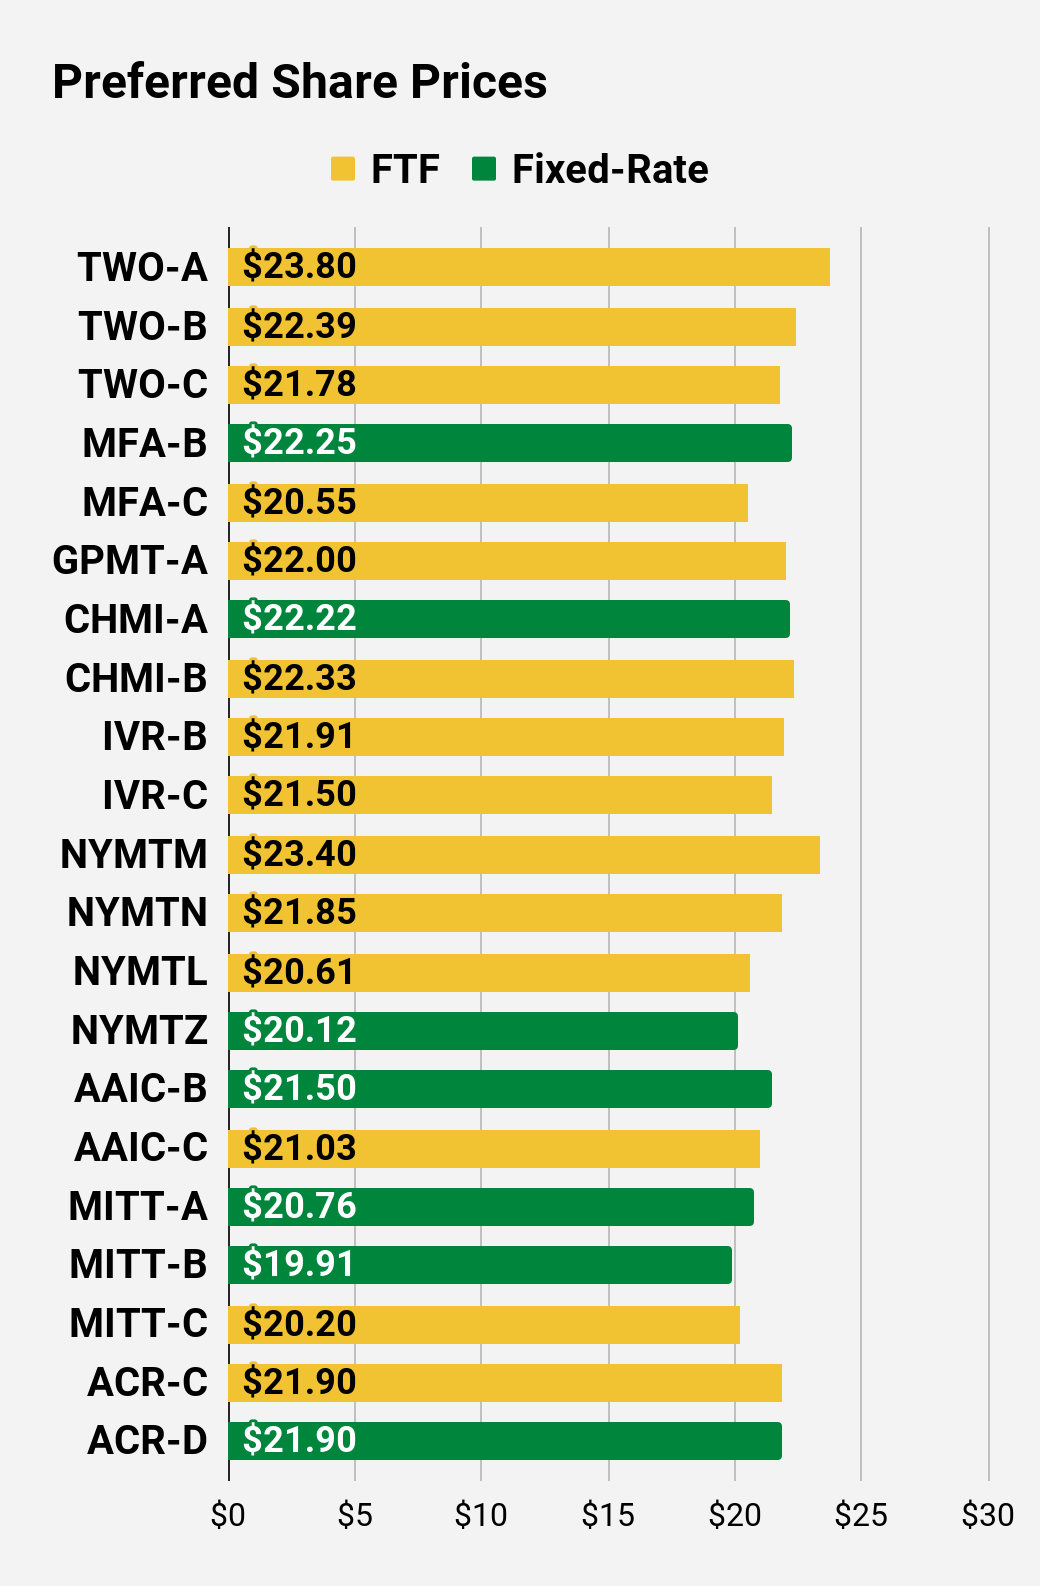
- Price = Recent Share Price – Shown in Charts
- BoF = Bond or FTF (Fixed-to-Floating)
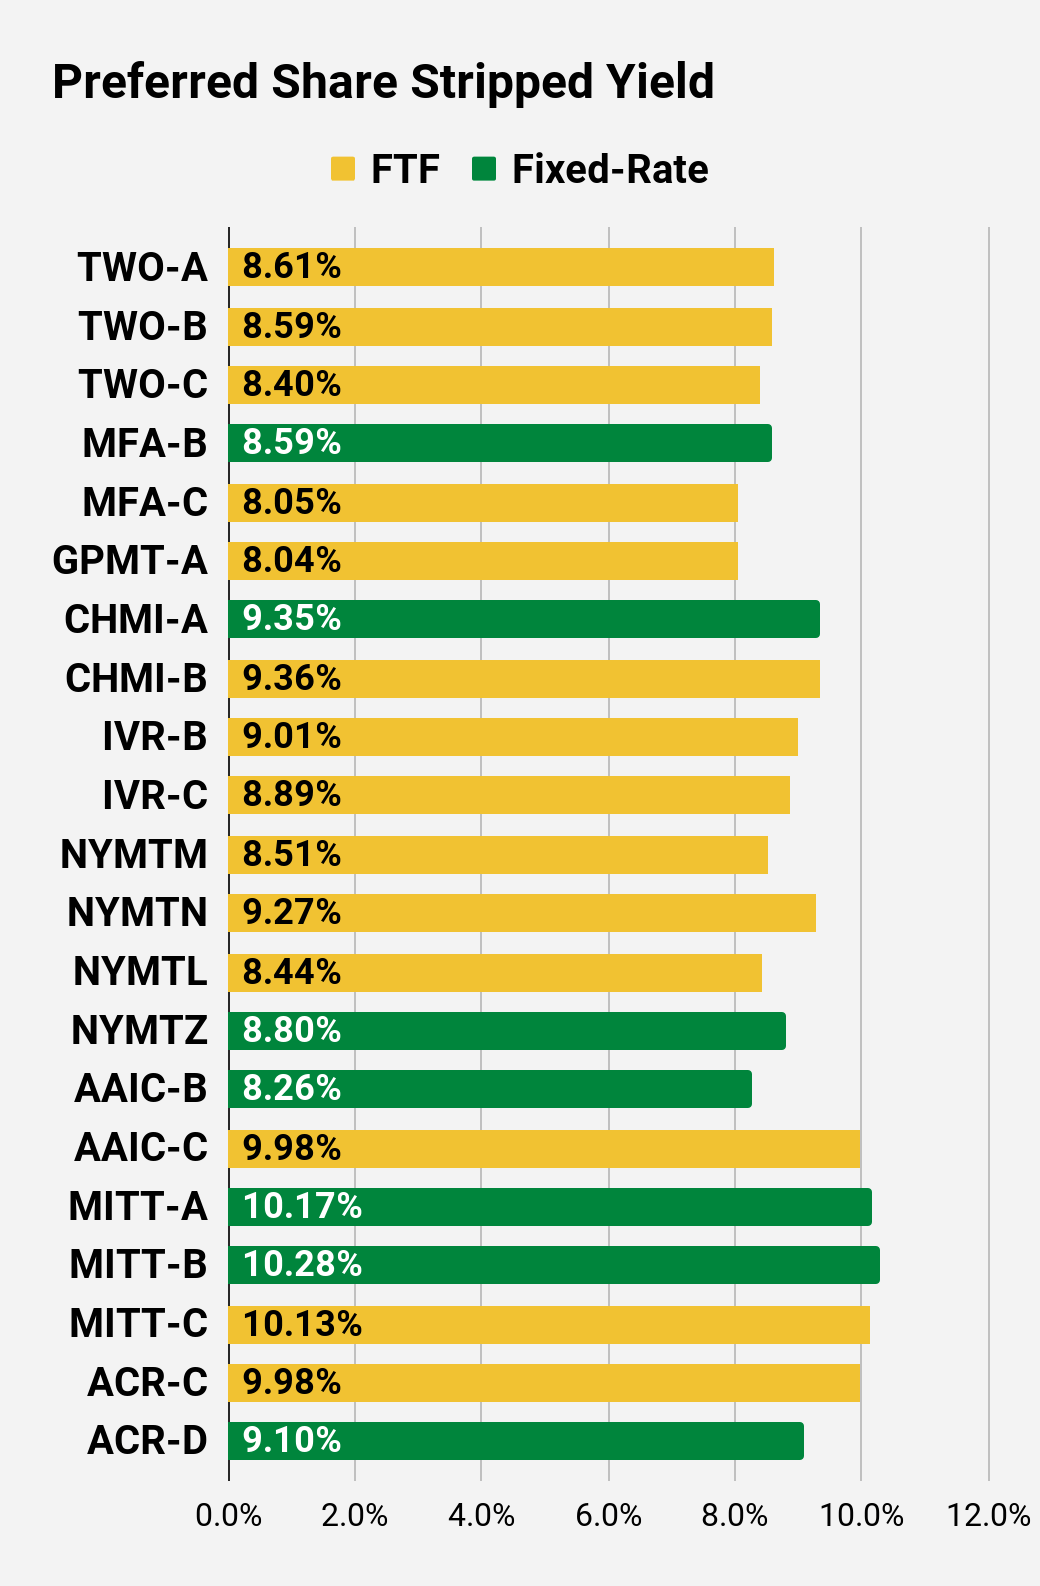
- S-Yield = Stripped Yield – Shown in Charts
- Coupon = Initial Fixed-Rate Coupon
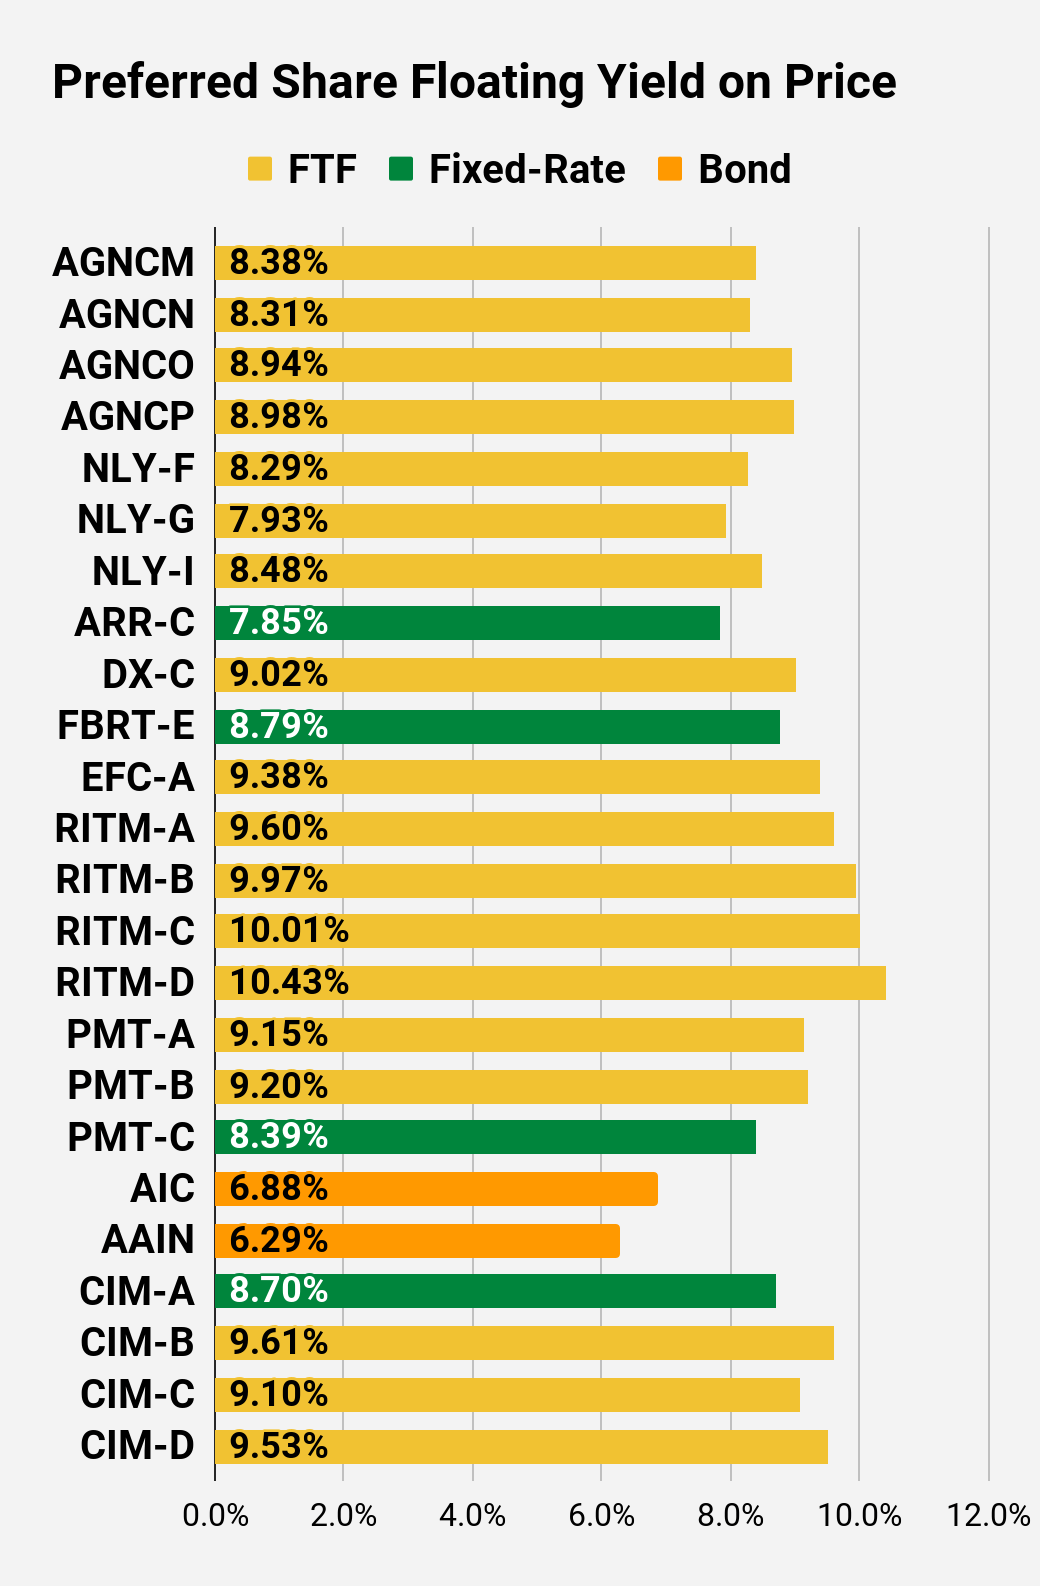
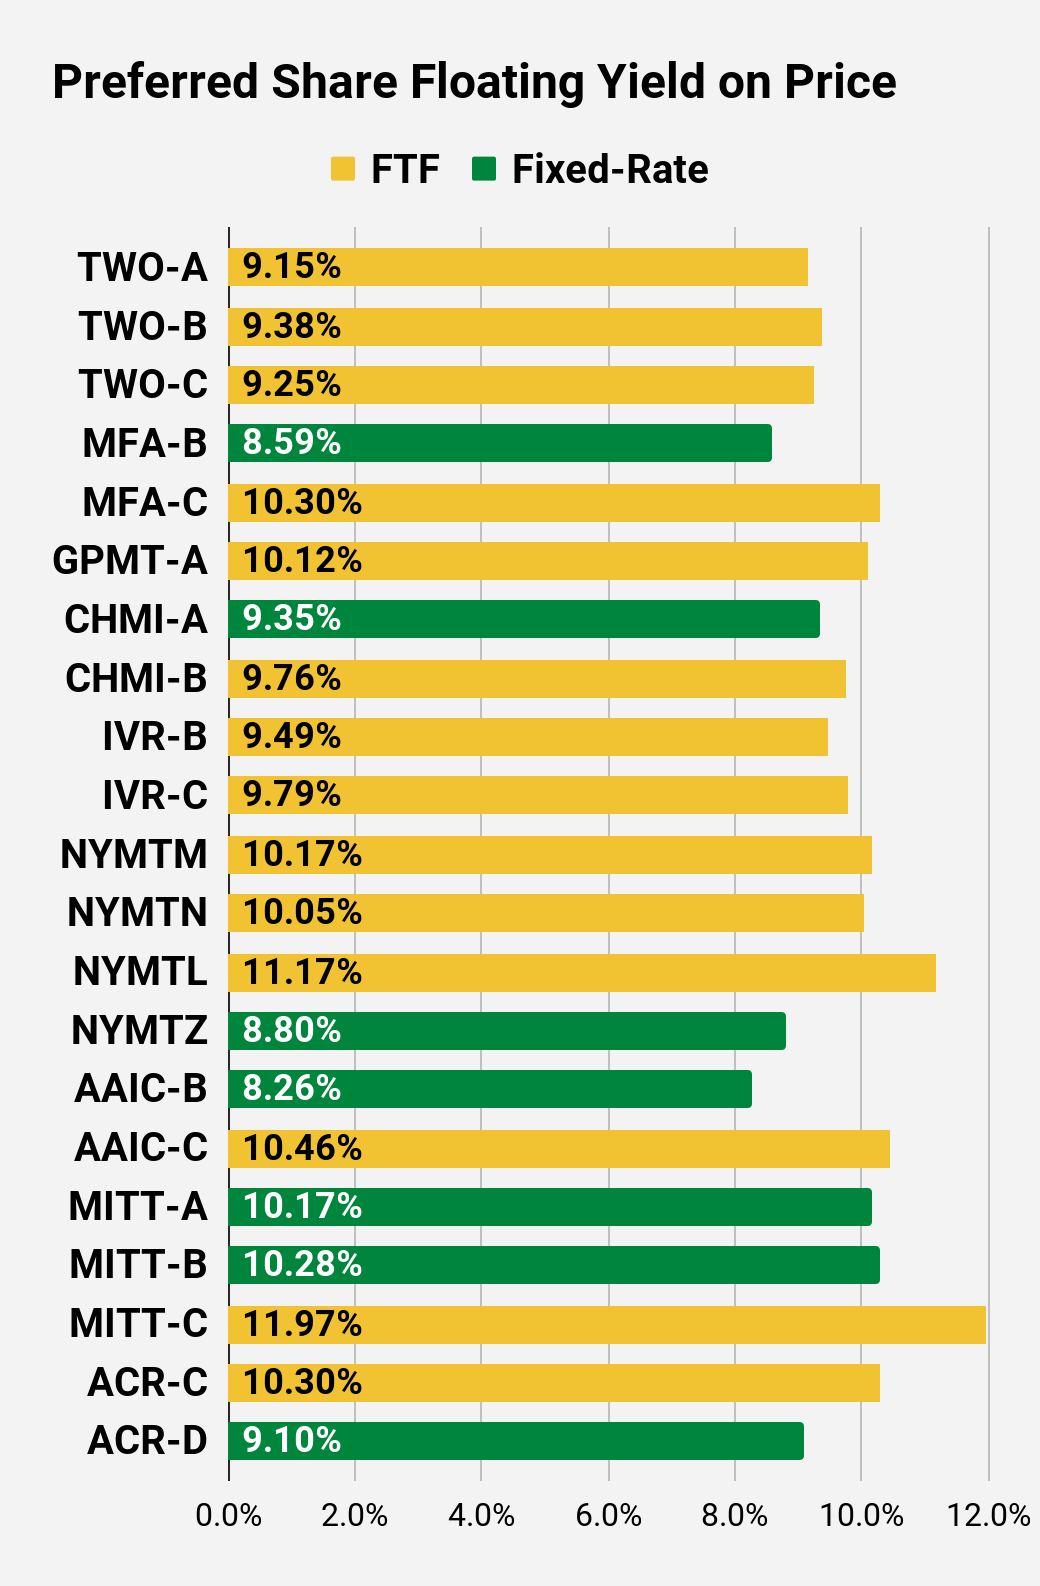
- FYoP = Floating Yield on Price – Shown in Charts
- NCD = Next Call Date (the soonest shares could be called)
- Note: For all FTF issues, the floating rate would start on NCD.
- WCC = Worst Cash to Call (lowest net cash return possible from a call)
- QO Link = Link to Quantum Online Page
| Ticker | Price | BoF | S-Yield | Coupon | FYoP | NCD | WCC |
| AGNCM | $22.03 | FTF | 7.89% | 6.88% | 8.38% | 4/15/2024 | $5.99 |
| AGNCN | $24.56 | FTF | 7.20% | 7.00% | 8.31% | 10/15/2022 | $0.88 |
| AGNCO | $22.50 | FTF | 7.29% | 6.50% | 8.94% | 10/15/2024 | $6.17 |
| AGNCP | $21.58 | FTF | 7.16% | 6.13% | 8.98% | 4/15/2025 | $7.64 |
| NLY-F | $24.42 | FTF | 7.23% | 6.95% | 8.29% | 9/30/2022 | $1.02 |
| NLY-G | $22.90 | FTF | 7.21% | 6.50% | 7.93% | 3/31/2023 | $3.32 |
| NLY-I | $23.85 | FTF | 7.19% | 6.75% | 8.48% | 6/30/2024 | $4.53 |
| ARR-C | $22.31 | 7.85% | 7.00% | 7.85% | 1/28/2025 | $6.93 | |
| DX-C | $23.61 | FTF | 7.38% | 6.90% | 9.02% | 4/15/2025 | $6.13 |
| FBRT-E | $21.60 | 8.79% | 7.50% | 8.79% | 9/17/2022 | $3.73 | |
| EFC-A | $22.01 | FTF | 7.75% | 6.75% | 9.38% | 10/30/2024 | $6.87 |
| RITM-A | $23.04 | FTF | 8.20% | 7.50% | 9.60% | 8/15/2024 | $5.73 |
| RITM-B | $21.79 | FTF | 8.24% | 7.13% | 9.97% | 8/15/2024 | $6.79 |
| RITM-C | $20.00 | FTF | 8.03% | 6.38% | 10.01% | 2/15/2025 | $9.00 |
| RITM-D | $22.35 | FTF | 7.89% | 7.00% | 10.43% | 11/15/2026 | $10.11 |
| PMT-A | $24.50 | FTF | 8.44% | 8.13% | 9.15% | 3/15/2024 | $4.06 |
| PMT-B | $24.81 | FTF | 8.21% | 8.00% | 9.20% | 6/15/2024 | $4.20 |
| PMT-C | $20.49 | 8.39% | 6.75% | 8.39% | 8/24/2026 | $11.59 | |
| AIC | $24.93 | Bond | 6.88% | 6.75% | 6.88% | 9/17/2022 | $0.51 |
| AAIN | $23.98 | Bond | 6.29% | 6.00% | 6.29% | 8/1/2023 | $2.52 |
| CIM-A | $23.43 | 8.70% | 8.00% | 8.70% | 9/17/2022 | $2.09 | |
| CIM-B | $23.25 | FTF | 8.77% | 8.00% | 9.61% | 3/30/2024 | $5.34 |
| CIM-C | $21.64 | FTF | 9.13% | 7.75% | 9.10% | 9/30/2025 | $9.75 |
| CIM-D | $22.36 | FTF | 9.12% | 8.00% | 9.53% | 03/30/2024 | $6.23 |
Second Batch:
| Ticker | Price | BoF | S-Yield | Coupon | FYoP | NCD | WCC | QO Link | P-Link |
| TWO-A | $23.80 | FTF | 8.61% | 8.13% | 9.15% | 04/27/2027 | $10.85 | TWO-A | Prospectus |
| TWO-B | $22.39 | FTF | 8.59% | 7.63% | 9.38% | 07/27/2027 | $12.14 | TWO-B | Prospectus |
| TWO-C | $21.78 | FTF | 8.40% | 7.25% | 9.25% | 1/27/2025 | $7.76 | TWO-C | Prospectus |
| MFA-B | $22.25 | 8.59% | 7.50% | 8.59% | 9/17/2022 | $3.17 | MFA-B | Prospectus | |
| MFA-C | $20.55 | FTF | 8.05% | 6.50% | 10.30% | 3/31/2025 | $8.94 | MFA-C | Prospectus |
| GPMT-A | $22.00 | FTF | 8.04% | 7.00% | 10.12% | 11/30/2026 | $10.65 | GPMT-A | Prospectus |
| CHMI-A | $22.22 | 9.35% | 8.20% | 9.35% | 9/17/2022 | $3.06 | CHMI-A | Prospectus | |
| CHMI-B | $22.33 | FTF | 9.36% | 8.25% | 9.76% | 4/15/2024 | $6.21 | CHMI-B | Prospectus |
| IVR-B | $21.91 | FTF | 9.01% | 7.75% | 9.49% | 12/27/2024 | $7.96 | IVR-B | Prospectus |
| IVR-C | $21.50 | FTF | 8.89% | 7.50% | 9.79% | 9/27/2027 | $13.37 | IVR-C | Prospectus |
| NYMTM | $23.40 | FTF | 8.51% | 7.88% | 10.17% | 1/15/2025 | $6.53 | NYMTM | Prospectus |
| NYMTN | $21.85 | FTF | 9.27% | 8.00% | 10.05% | 10/15/2027 | $13.65 | NYMTN | Prospectus |
| NYMTL | $20.61 | FTF | 8.44% | 6.88% | 11.17% | 10/15/2026 | $11.70 | NYMTL | Prospectus |
| NYMTZ | $20.12 | 8.80% | 7.00% | 8.80% | 1/15/2027 | $12.76 | NYMTZ | Prospectus | |
| AAIC-B | $21.50 | 8.26% | 7.00% | 8.26% | 9/17/2022 | $3.81 | AAIC-B | Prospectus | |
| AAIC-C | $21.03 | FTF | 9.98% | 8.25% | 10.46% | 3/30/2024 | $7.50 | AAIC-C | Prospectus |
| MITT-A | $20.76 | 10.17% | 8.25% | 10.17% | 9/17/2022 | $4.74 | MITT-A | Prospectus | |
| MITT-B | $19.91 | 10.28% | 8.00% | 10.28% | 9/17/2022 | $5.58 | MITT-B | Prospectus | |
| MITT-C | $20.20 | FTF | 10.13% | 8.00% | 11.97% | 9/17/2024 | $9.29 | MITT-C | Prospectus |
| ACR-C | $21.90 | FTF | 9.98% | 8.63% | 10.30% | 7/30/2024 | $7.42 | ACR-C | Prospectus |
| ACR-D | $21.90 | 9.10% | 7.88% | 9.10% | 5/21/2026 | $10.60 | ACR-D | Prospectus |
Strategy
Our goal is to maximize total returns. We achieve those most effectively by including “trading” strategies. We regularly trade positions in the mortgage REIT common shares and BDCs because:
- Prices are inefficient.
- Long-term, share prices generally revolve around book value.
- Short-term, price-to-book ratios can deviate materially.
- Book value isn’t the only step in analysis, but it is the cornerstone.
We also allocate to preferred shares and equity REITs. We encourage buy-and-hold investors to consider using more preferred shares and equity REITs.
Performance
We compare our performance against 4 exchange-traded funds (“ETFs”) that investors might use for exposure to our sectors:
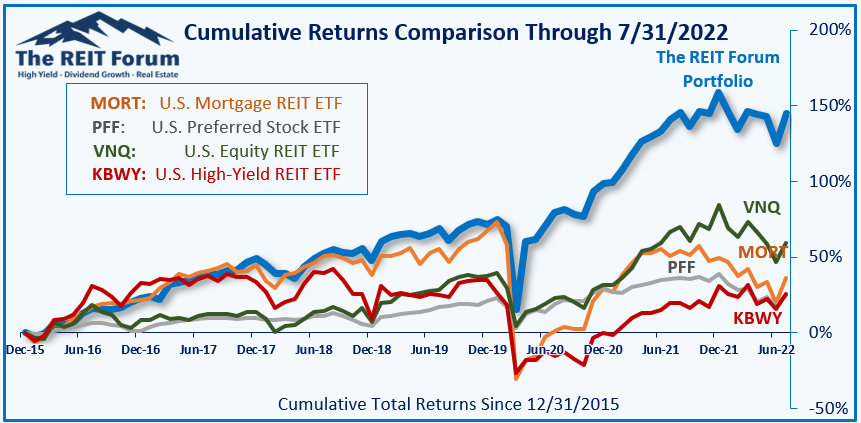
The 4 ETFs we use for comparison are:
| Ticker | Exposure |
| MORT | One of the largest mortgage REIT ETFs |
| PFF | One of the largest preferred share ETFs |
| VNQ | Largest equity REIT ETF |
| KBWY | The high-yield equity REIT ETF. Yes, it has been dreadful. |
When investors think it isn’t possible to earn solid returns in preferred shares or mortgage REITs, we politely disagree. The sector has plenty of opportunities, but investors still need to be wary of the risks. We can’t simply reach for yield and hope for the best. When it comes to common shares, we need to be even more vigilant to protect our principal by regularly watching prices and updating estimates for book value and price targets.
Photo by Jason Dent on Unsplash