

Summary
- Prices are falling hard.
- Fear is a significant factor, but we also need to view the fundamentals.
- The charts here will help. We’re also sharing five picks for attractive values today.
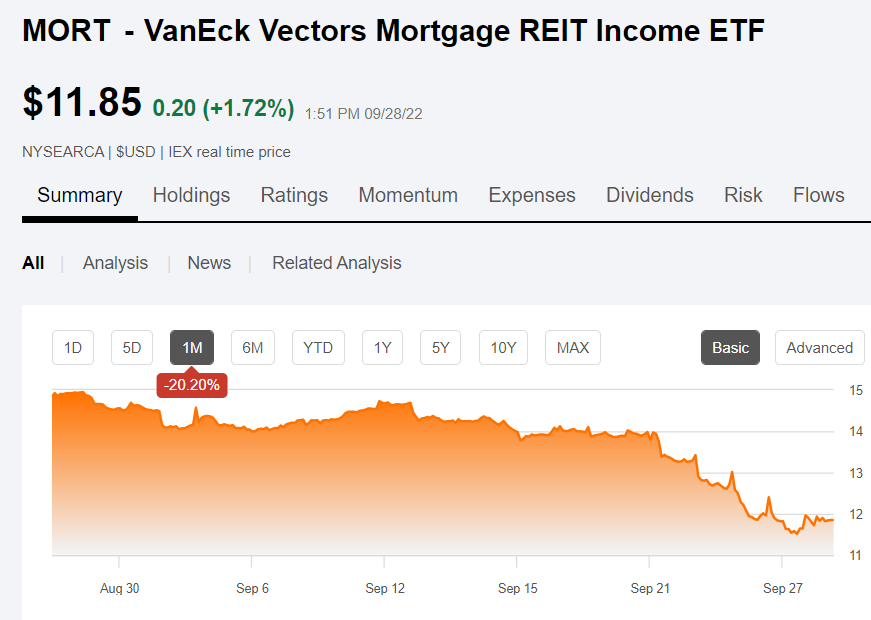
Did mortgage REITs die? It sure can feel that way when investors are looking at the plunging share price. The ETF is down more than 14% in a week.
Sentiment is clearly one factor as almost every stock in the market is down. There will be a few exceptions, but it’s almost all of them.
However, book values also are down as mortgage REITs face rising yields (which usually reduce book value) and widening spreads between agency MBS and Treasury rates (which consistently reduce book value).
So how much should we attribute to each factor?
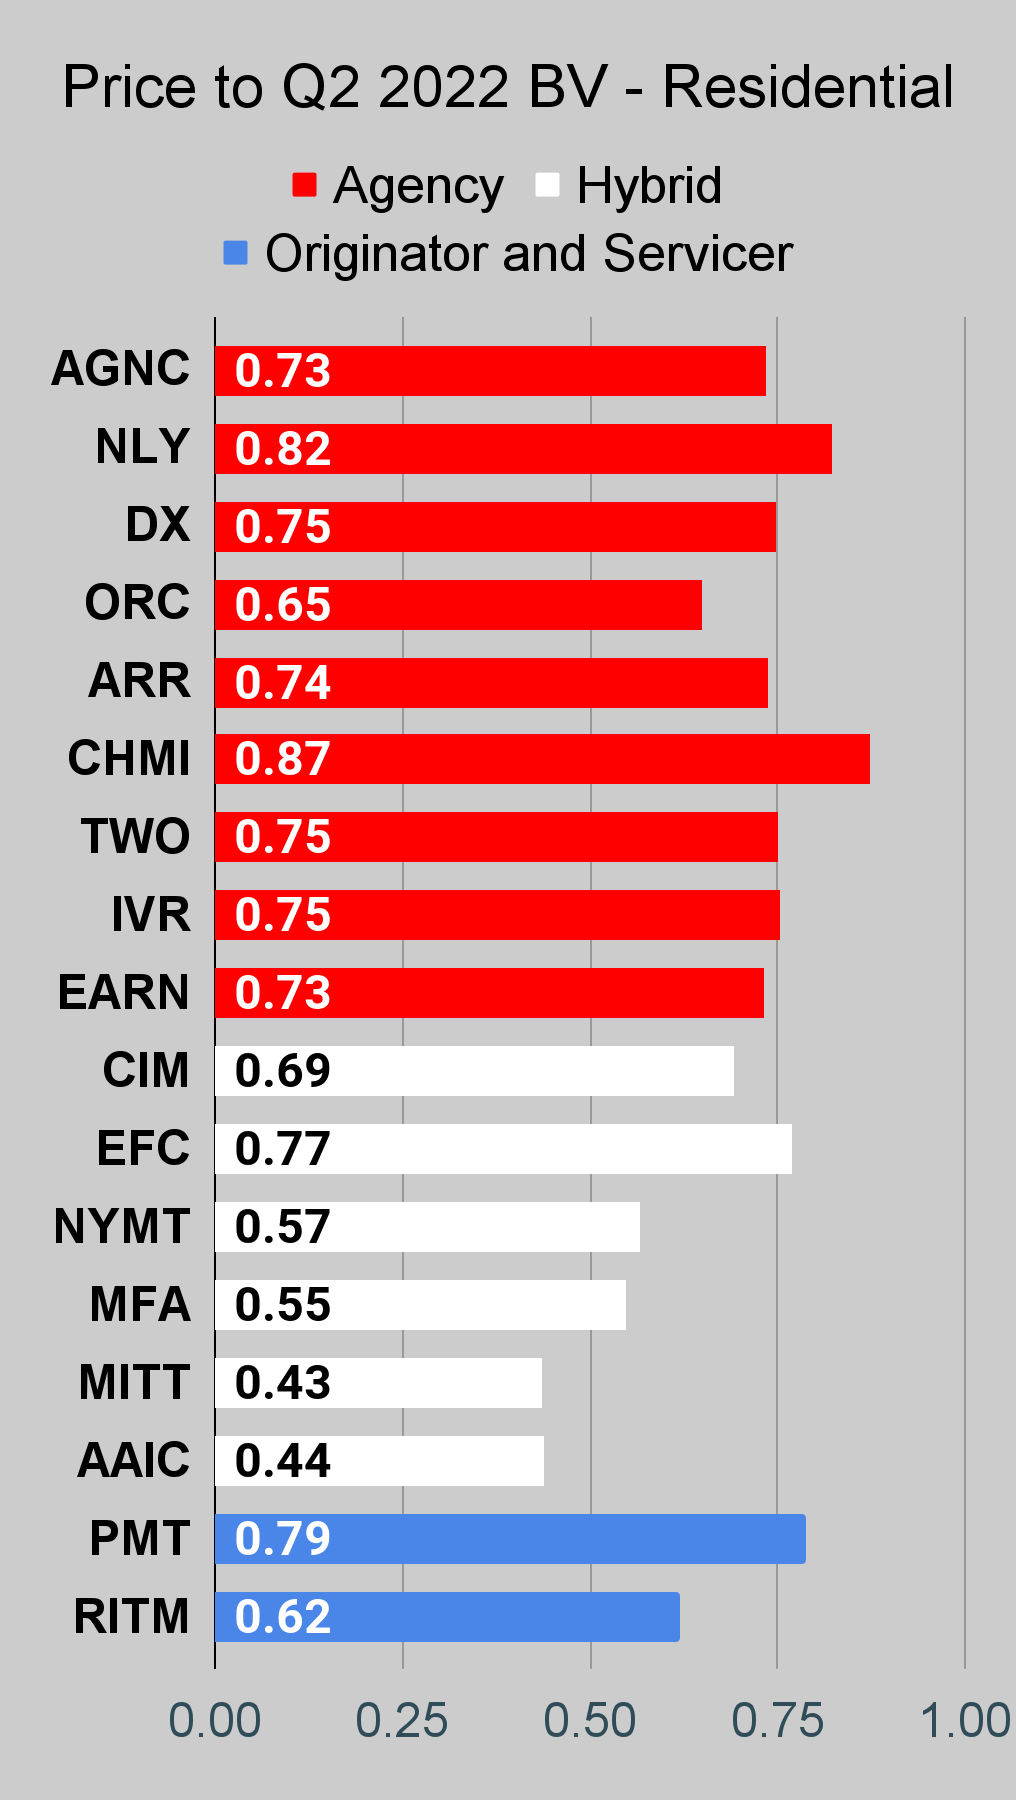
Well, we view the majority of the decline as being driven by a shift in sentiment. While book values are lower, a large portion of the decline in share prices is simply a lower price-to-book ratio.
That’s particularly interesting for investors because wider spreads between agency MBS and Treasury rates indicate that mortgage REITs can invest more profitably.
Assets
Some mortgage REITs are focused on credit-related assets, such as mortgages with a higher yield that don’t have agency backing. Others focus on agency MBS, which are MBS backed by the major agencies like Fannie / Freddie.
How much can a mortgage REIT earn by buying agency MBS today?
Nearly 6%. I’ll share a few charts from late on 9/27/2022.
The 30YR UMBS 6.0 refers to a 30-year fixed-rate agency MBS with a 6.0% coupon rate. This security is currently trading at $100.50 per $100.00 of principal value.
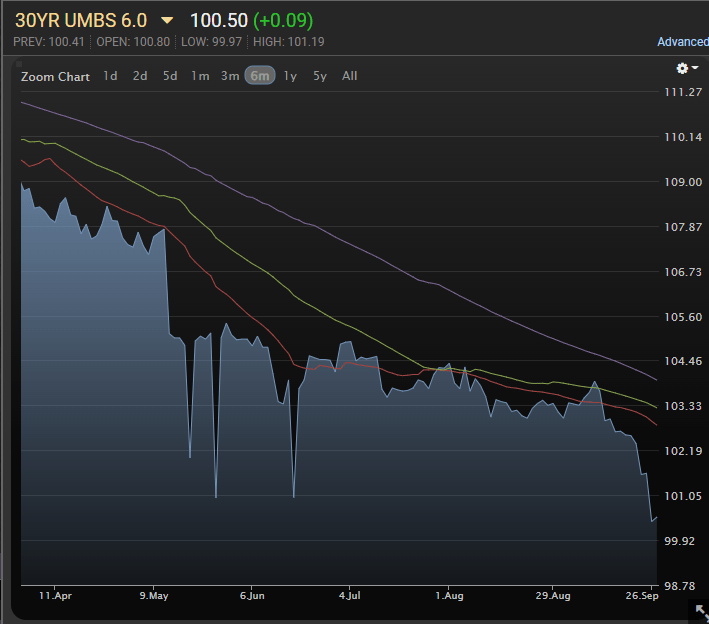
If the homeowners didn’t prepay a single penny, the actual yield would come out pretty close to 6.0% because the $.50 would be amortized over 30 years. However, even if the homeowner was expected to pay the mortgage off after five years, the yield would be about 5.9%. That’s because the $.50 premium would be amortized at $.10 per year. That’s 0.1% of the total amount, so it drags the yield lower by about 0.1%.
The mortgage REIT would collect $6.00 in interest income and deduct the $.10 for amortization. Principal outstanding and thus interest actually decreases a bit each year, but that principal can be reinvested.
This leaves the mortgage REIT collecting about $5.90 in interest income for the year. That’s a good deal.
They could finance this using repurchase agreements that roll over frequently, or they could use longer repurchase agreements. The repurchase agreement is how they get access to leverage. The market usually works pretty well, though there have been a few snags over the years (mainly the pandemic).
What about rising short-term rates? Won’t those create a problem? The mortgage REIT would attempt to mitigate those risks by using something like an interest rate swap. They could use a 5-year swap and get a rate similar to 4.2% (the 5-year Treasury rate). That would leave them with a spread of 1.7% between the yield on assets and the cost of funds.
If they simply leverage that spread 5 times, it would be 8.5%. However, they also would be earning 5.9% on the assets they financed with equity. That gives them 14.4% in interest income on book value. They would still have some overhead expenses to pay, but this is the recipe for generating large amounts of net interest income.
Why Did They Get Crushed?
Mortgage REITs have been awful year-to-date. Some more than others, but in general it’s been bad. Why was it so awful? Well, the spread between Treasury rates and MBS rates was much thinner at the start of the year. The spread between the yield on a new 30-year fixed-rate MBS and a five-year Treasury was about 0.78%. Leverage that up 5 times and you get 3.9%. That’s not good. If the MBS was one purchased near face value, it would’ve had a yield of about 2.04%. Combine those to get a dreadful 5.94%.
Despite that, plenty of mortgage REITs that were roughly following this playbook (often with more leverage) were trading around book value. Of course, they had higher dividend yields. How did that happen? Well, many of them had some hedges in place already at lower rates. Consequently, they could report a much lower cost of funds. The benefit of those hedges already was baked into book value, but it lowered interest expense as it flowed through the income statement. This encourages investors to believe that much higher yields were sustainable.
How does that work? Let’s say you have a hedge that allows you to pay an interest rate that’s 1% below the current interest rate for the next five years. How much is that hedge worth? Well, you’ll save roughly $1.00 per $100 of face value each year. Over five years, you save $5.00. Therefore, the value of the hedge is nearly $5.00. With discounting future cash flows, it would be a tiny bit less, but still pretty close to $5.00. The problem is that investors see that savings and of $1.00 each year and pretend that this is going to be normal. It can last for a few years, but the benefit already is in the book value.
What Happened?
Interest rates ripped higher and Agency MBS prices plunged. The value of hedges roared higher, but it wasn’t enough to offset the decline in the value of the MBS.
Allow me to demonstrate. This is the 30YR UMBS 4.0:
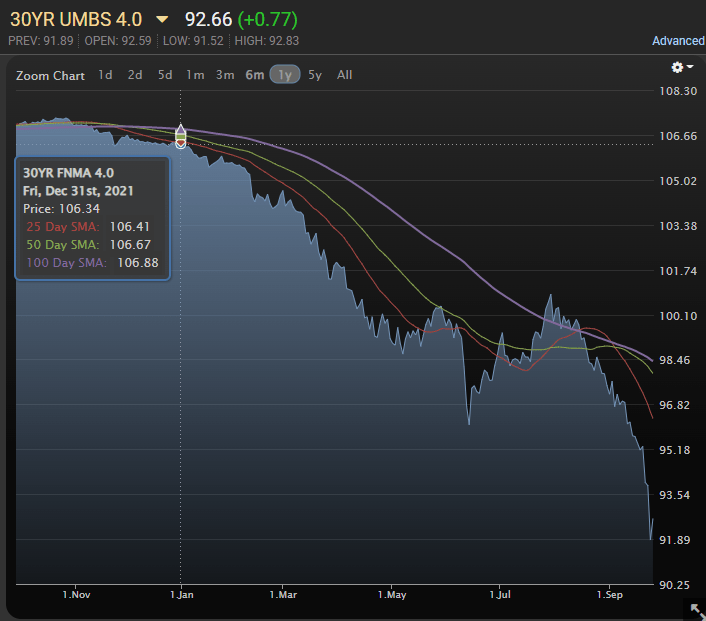
It started the year at $106.34. Today it’s worth $92.66.
The investor is still guaranteed the full amount of cash flows. However, it doesn’t look so appealing today. The value of the agency MBS dropped by $13.68, which is 12.8644%.
To be hedged against that, the mortgage REIT needed to be shorting something with nearly five years of duration. The five-year Treasury yield rose from 1.263% to 4.196%. If we ignored that part of the five-year period passed, we would estimate that the value of the five-year Treasury would be lower by more than 14%. That would be enough to offset the loss on the MBS. However, that would be a pretty big hedge for a 30-year fixed-rate MBS with such a “high” coupon rate. Back then, the 4.0 was a high coupon rate. It could’ve been hedged with something smaller than a five-year Treasury.
The issue gets a bit bigger though. Many of the mortgage REITs were primarily holding mortgages with coupon rates far below 4.0. They were holding agency MBS with coupons in the 2% to 3% range. That homeowner knows they’re getting wrecked if they refinance or sell their home because they would lose the value of that attractive loan. My 15-year fixed-rate mortgage is at 2.125%. Think I’m going to prepay that at all? No. Some people will because they determine that they absolutely must move, but there’s no way I’m giving up that rate and many other people will see it the same way. That’s why the MBS prices fell so hard.
Risks
There are multiple risks remaining. No, I’m not just talking about dividend cuts. While the dividend is an important part of total return, we need to also consider share prices. Obviously, if an investor could get a 16% yield with no risk of it being cut, they could largely ignore the share price. They can’t. Therefore, the price still matters.
Fundamental Risks:
- Book values could still be negative impacted by movements in interest rates (upward momentum remains very strong). This reduces book value without improving future income per dollar of book value materially. This is “bad.”
- Further widening in spreads between agency MBS and Treasury rates could push book value lower. This increases earnings on each dollar of book value, and it can be recovered if spreads tighten in the future. Therefore, this isn’t “bad.”
- Lower book value leaves less capital to reinvest, and investors may not understand how the income and interest expenses actually work.
Non-fundamental risks:
- Price-to-book ratios could still move lower. This hurts current share prices but doesn’t change fundamentals.
- Dividends are always at risk. This is a reflection of the fundamental risk factors, but it can swing share prices on its own. The dividend is an outcome, stop using it as the input.
Thoughts
Price-to-book ratios are dramatically lower. My outlook on the sector is turning far more bullish. There are still a few mortgage REITs that are clearly not in bargain territory. However, the abundance of bargains is great for buyers. There are opportunities in both the common and preferred shares. Of course, there also will be a few people who yell that the sector is dead and will always be dead. If you need any comfort, go look at articles and news pieces posted from 3/27/2020 through 4/04/2020. You’ll see an abundance of “investors” claiming everything was going to $0. Not even one of them went to $0. Not even one. For preferred shares, almost all of the mortgage REIT preferred shares traded above $25.00 at some point in 2021. Don’t pay attention to investors who don’t know how the sector works.
Not to be entirely fair, that also includes investors who claim that they’re buying the common share for the dividend and don’t care about the price. Don’t pay attention to them either. Prices trend lower over long periods because that’s what happens in a sector that almost always has double-digit yields. That’s how things work. However, when prices get too low, they also spike dramatically higher while paying out a huge dividend. For investors willing to get in and out, it’s an exceptional opportunity. For investors looking for yield, the decline in the preferred shares is dramatically overdone. Many of those should recover to trade at least close to $25 within the next few years. I just published a large article for subscribers demonstrating in depth how the market is mispricing mortgage REIT preferred shares.
A Few Ratings
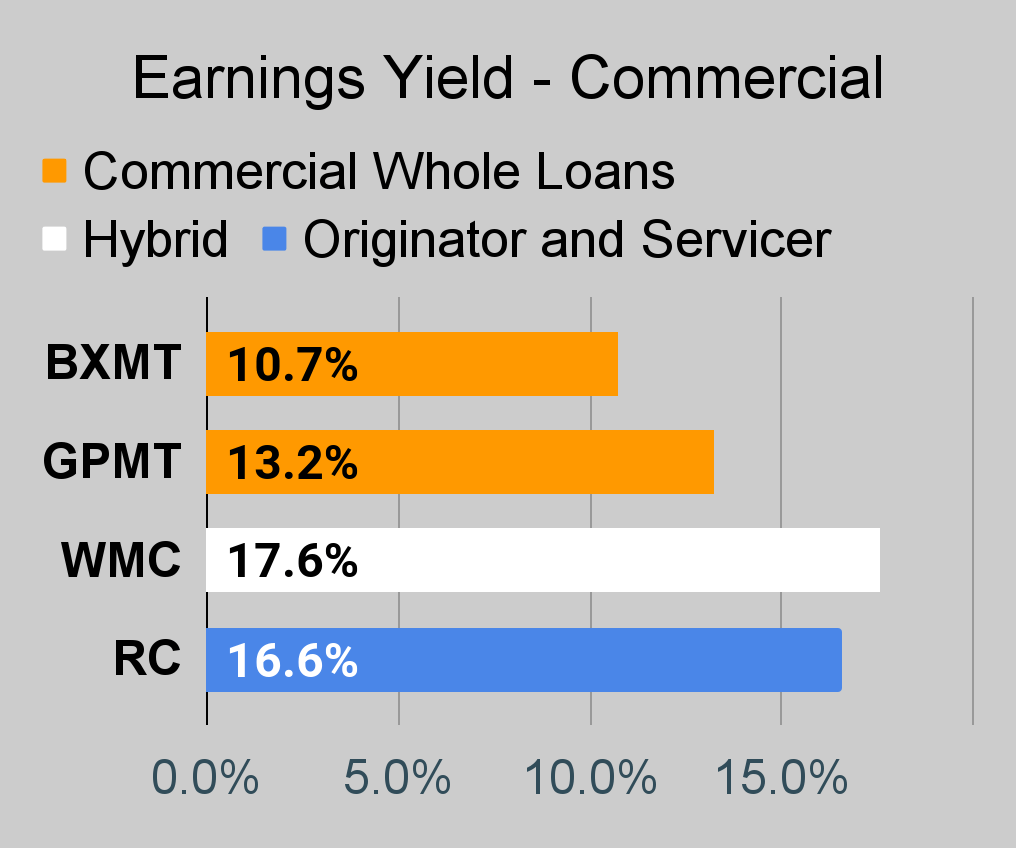
Rithm Capital (RITM), Ready Capital (RC), and Dynex Capital (DX) each look good. Common shares trade at a very material discount to our latest estimates of book value (as of 9/23/2022). Those estimates include the impact of substantial increases in interest rates and widening spreads between agency MBS and Treasuries.
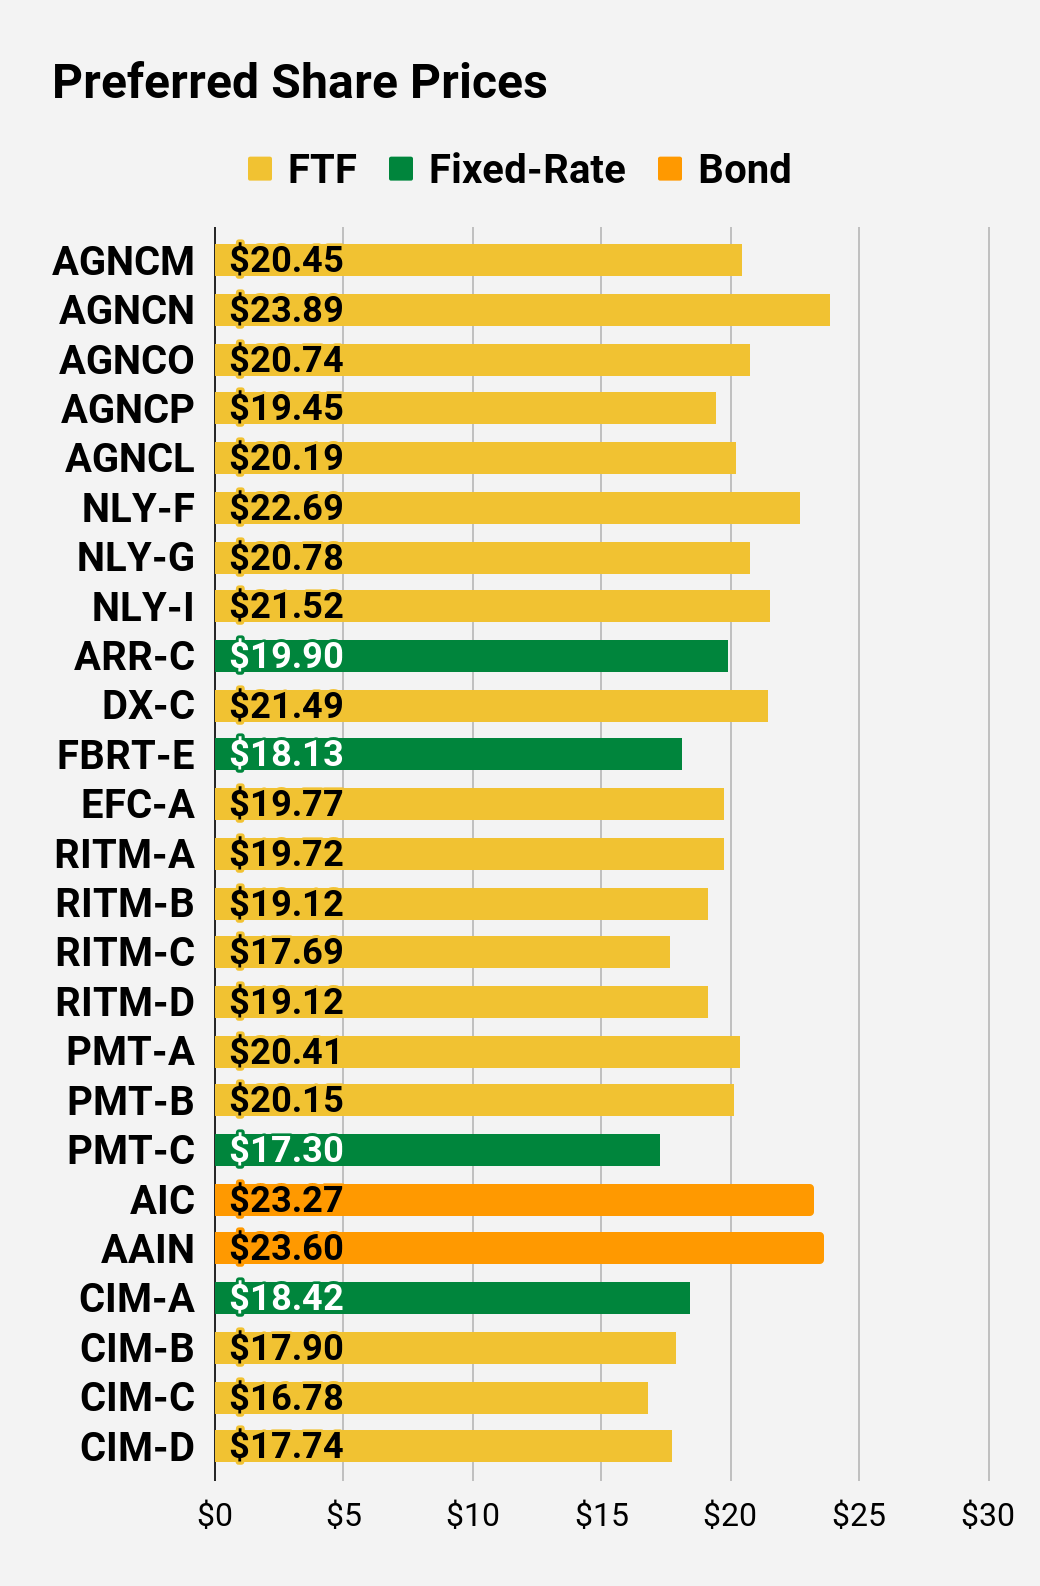
I’ll also call out AGNCP (AGNCP) yet again as shares remain cheap relative to peers and offer a very attractive total return over the next several years. I’m also switching our view on AGNCL (AGNCL). We blasted the valuation when they were announced and argued that they would need to plunge dramatically from $24.50 to offer a comparable value to the other preferred shares from AGNC. Shares of AGNCL trade at $20.19 today, which is down 17.6% in only a few weeks. They’re now in line with the other greater opportunities. Investors who paid $24.50 were guilty of brutalizing their portfolios. Investors paying $20.19 are getting a nice bargain.
We currently have far more bullish ratings than we’ve had in a very long time as rising rates and the recession created by those rates are driving prices much lower. The four shares we’ve listed here are only a small fraction of the opportunities in the sector. However, all opportunities are not created equal. Some are offering a far better risk/reward profile than others.
The rest of the charts in this article may be self-explanatory to some investors. However, if you’d like to know more about them, you’re encouraged to see our notes for the series. The part below is reproduced in each article to provide investors with easy access to the updated charts. It’s my gift to readers.
Stock Table
We will close out the rest of the article with the tables and charts we provide for readers to help them track the sector for both common shares and preferred shares.
We’re including a quick table for the common shares that will be shown in our tables:
| Type of REIT or BDC | ||||
| Residential Agency | Residential Hybrid | Residential Originator and Servicer | Commercial | BDC |
| AGNC | CIM | PMT | BXMT | MAIN |
| NLY | EFC | RITM | GPMT | CSWC |
| DX | NYMT | WMC | ARCC | |
| ORC | MFA | RC | TSLX | |
| ARR | MITT | TPVG | ||
| CHMI | AAIC | OCSL | ||
| TWO | GAIN | |||
| IVR | GBDC | |||
| EARN | SLRC | |||
| ORCC | ||||
| PFLT | ||||
| TCPC | ||||
| FSK | ||||
| PSEC | ||||
| MFIC |
Let the images begin!
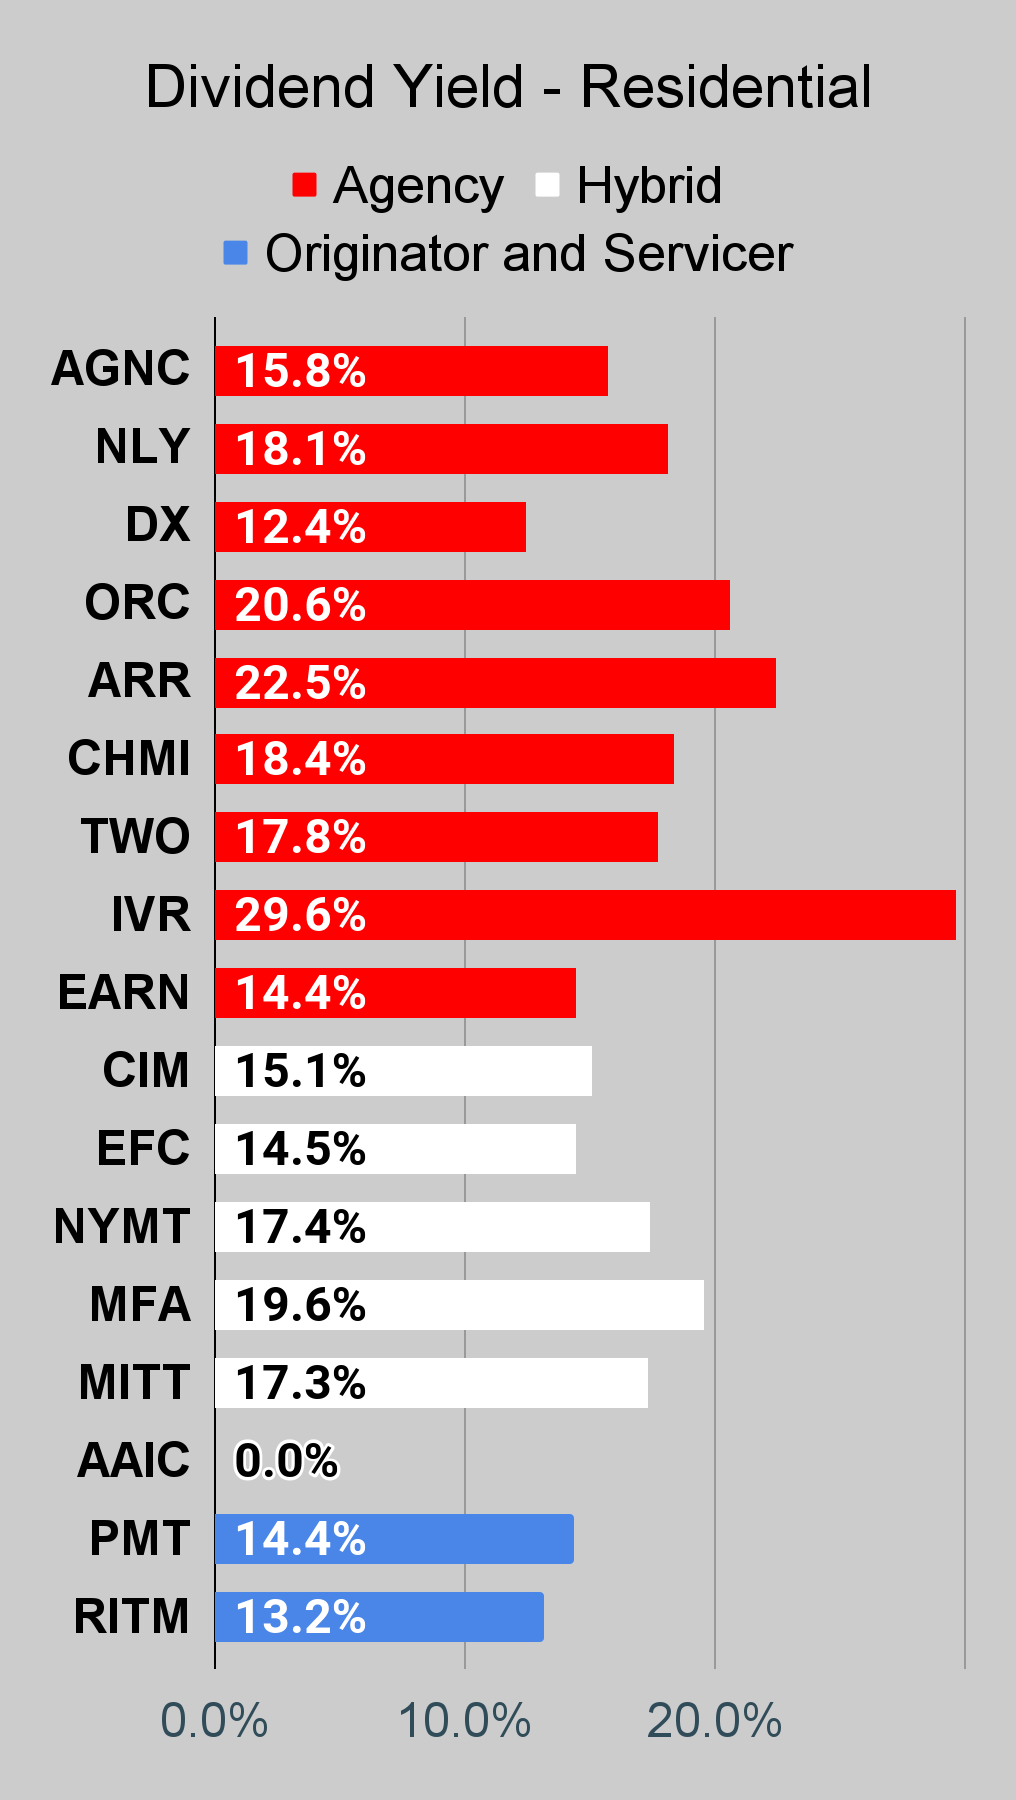
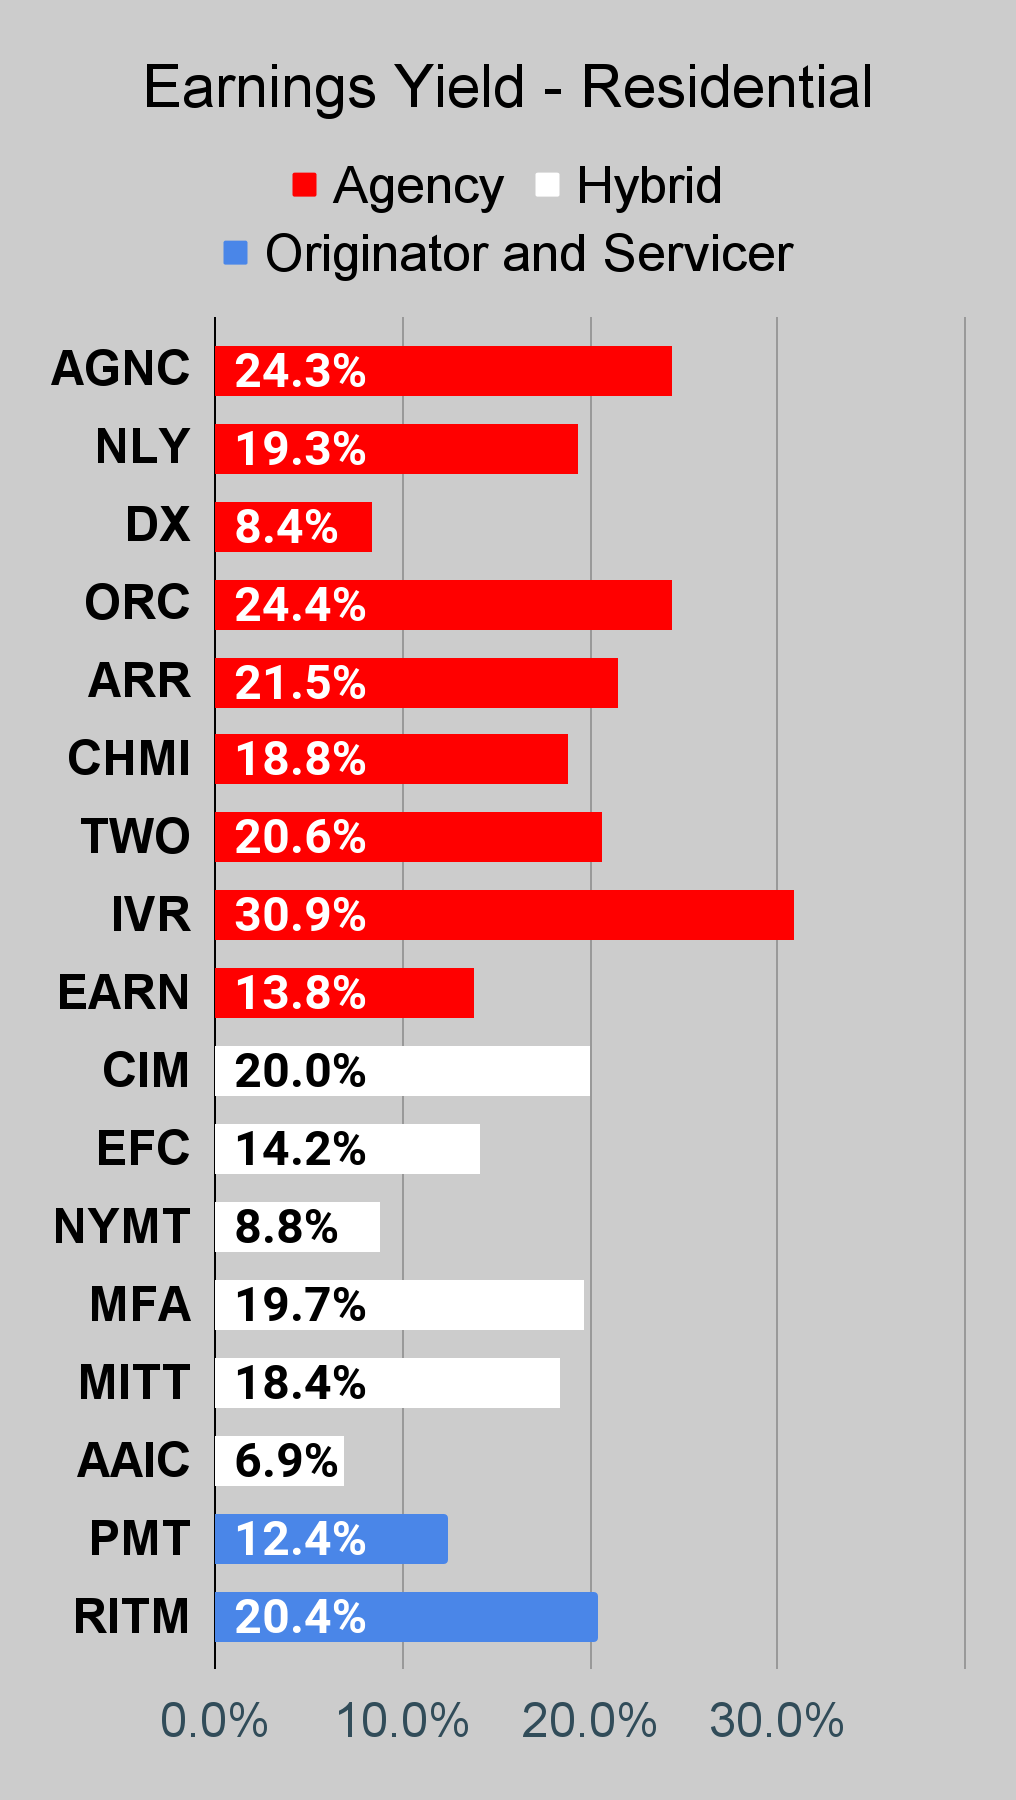
Residential Mortgage REIT Charts
Note: The chart for our public articles uses the book value per share from the latest earnings release. Current estimated book value per share is used in reaching our targets and trading decisions. It’s available in our service, but those estimates are not included in the charts below.
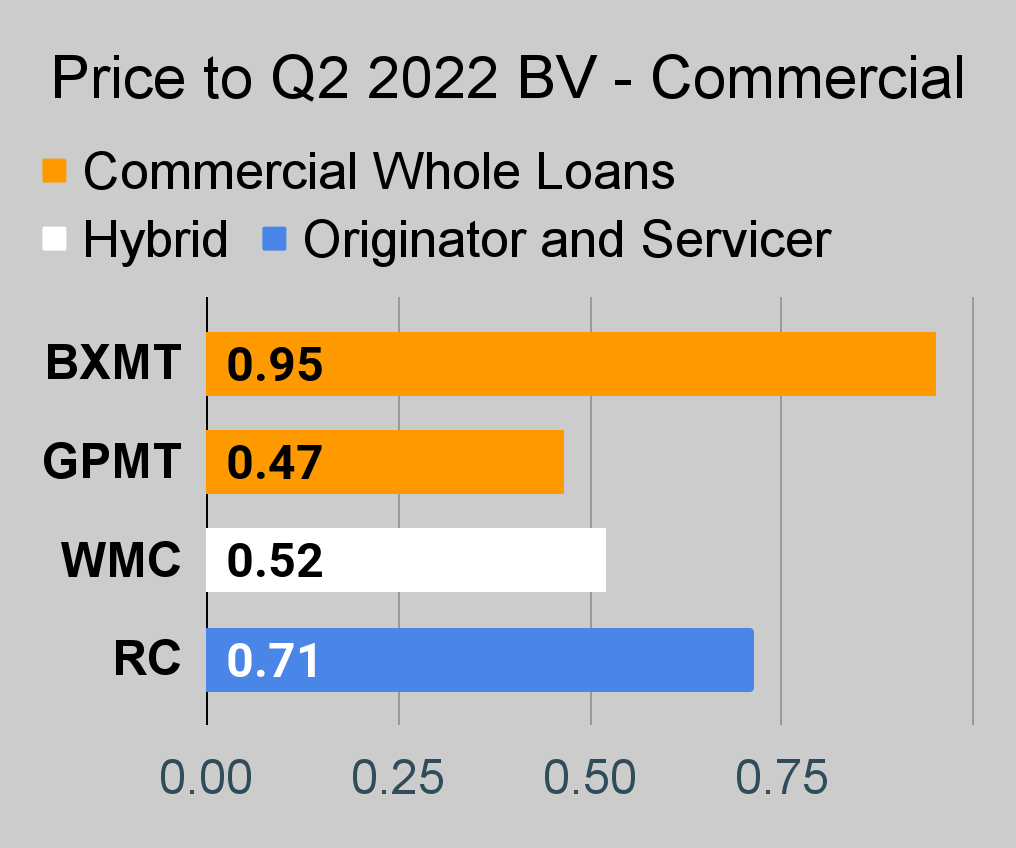
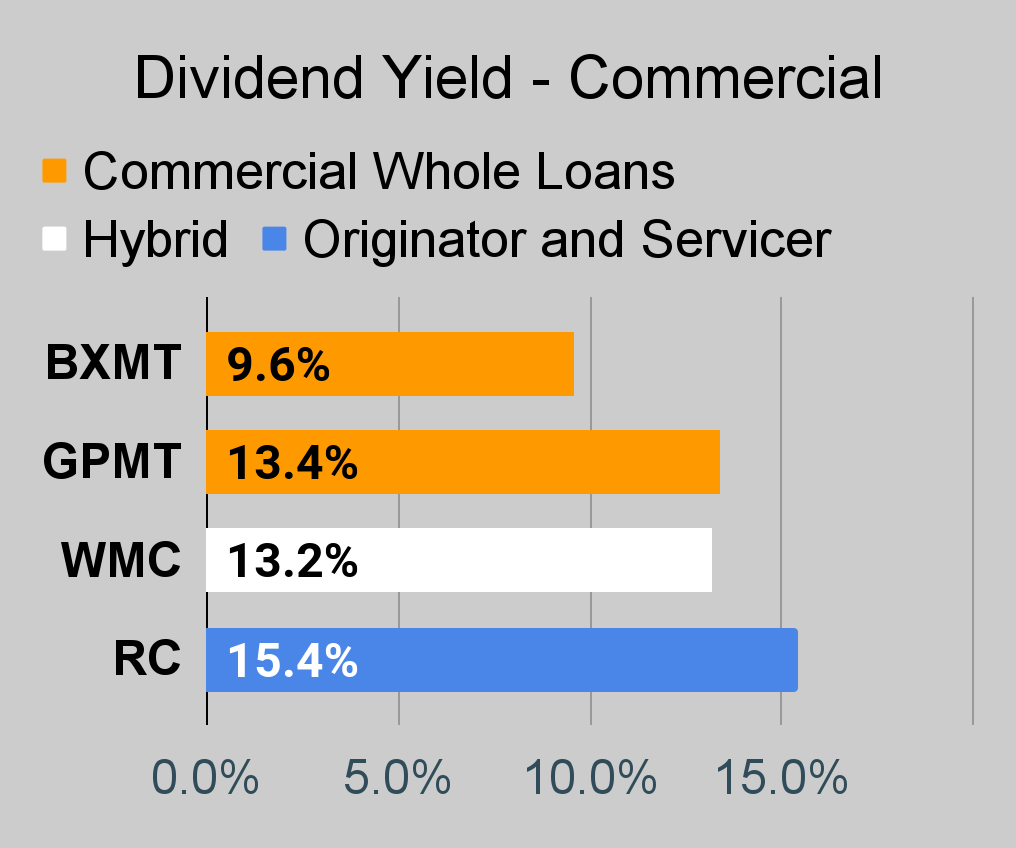
Commercial Mortgage REIT Charts
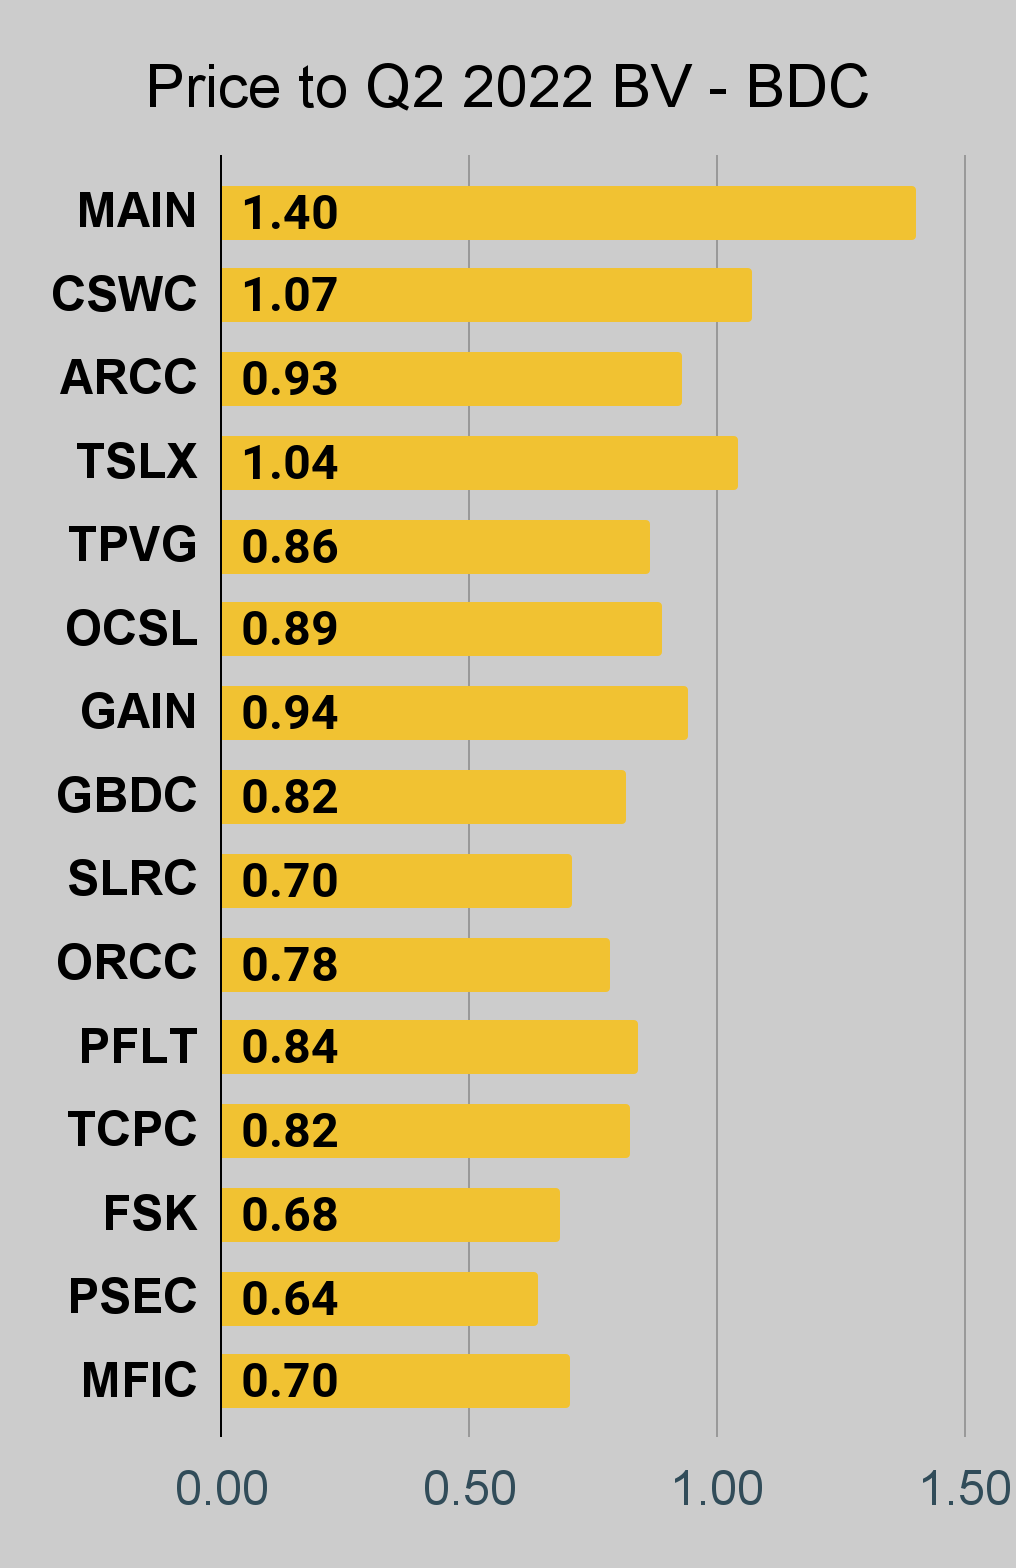
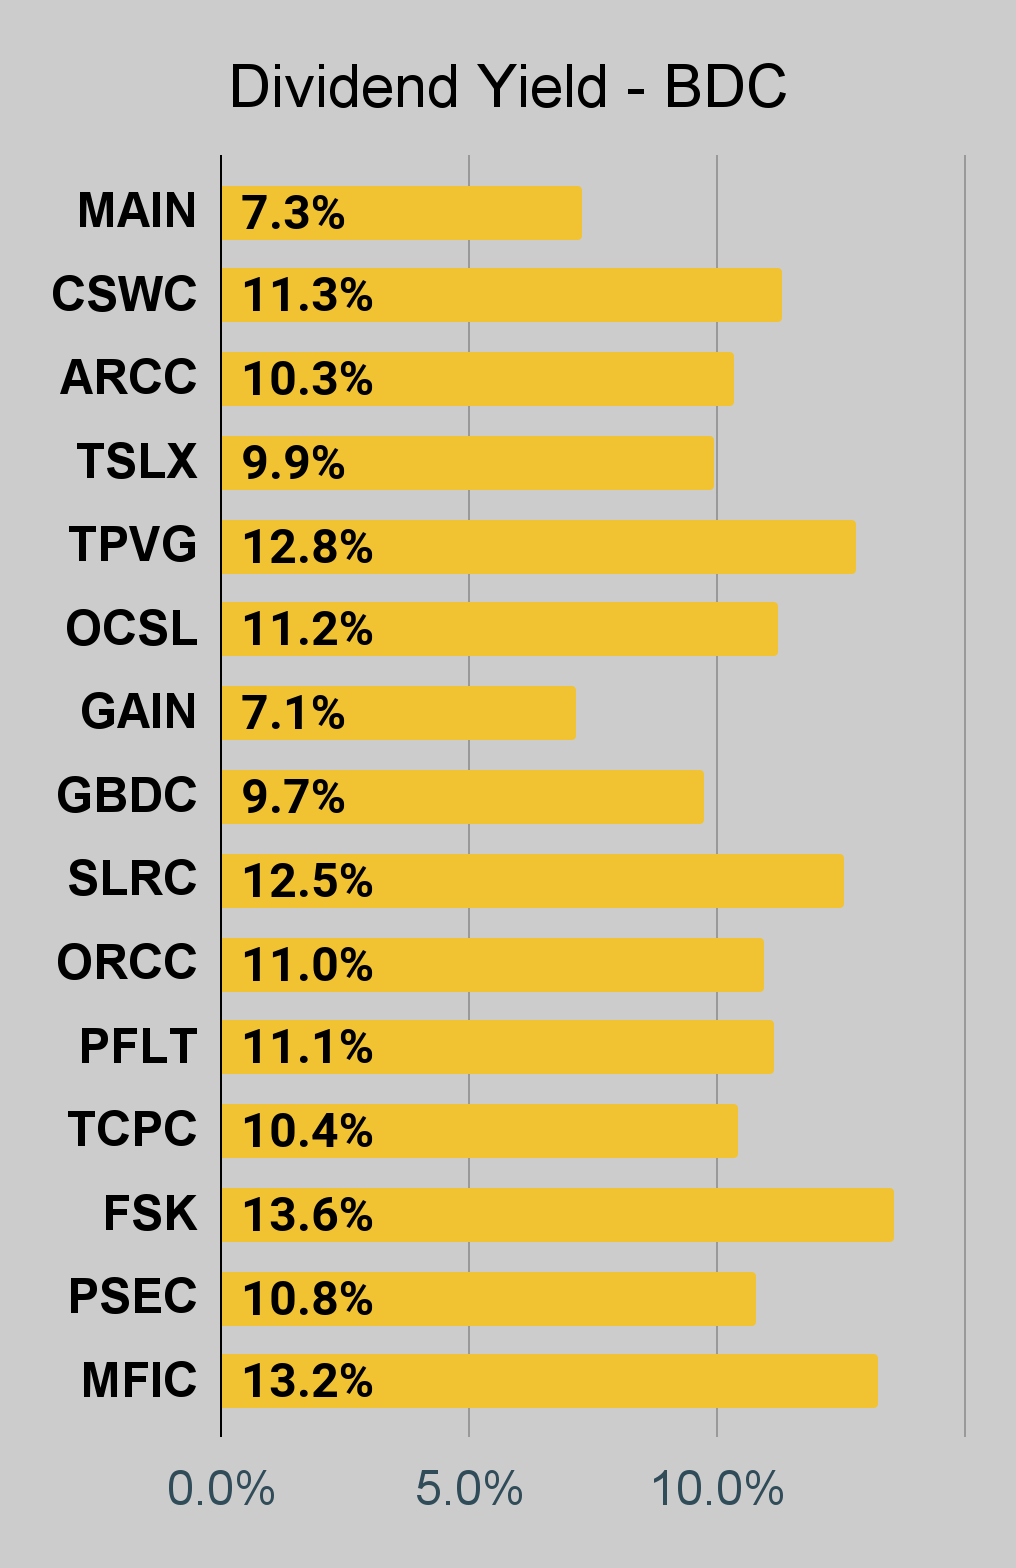
BDC Charts
Preferred Share Charts
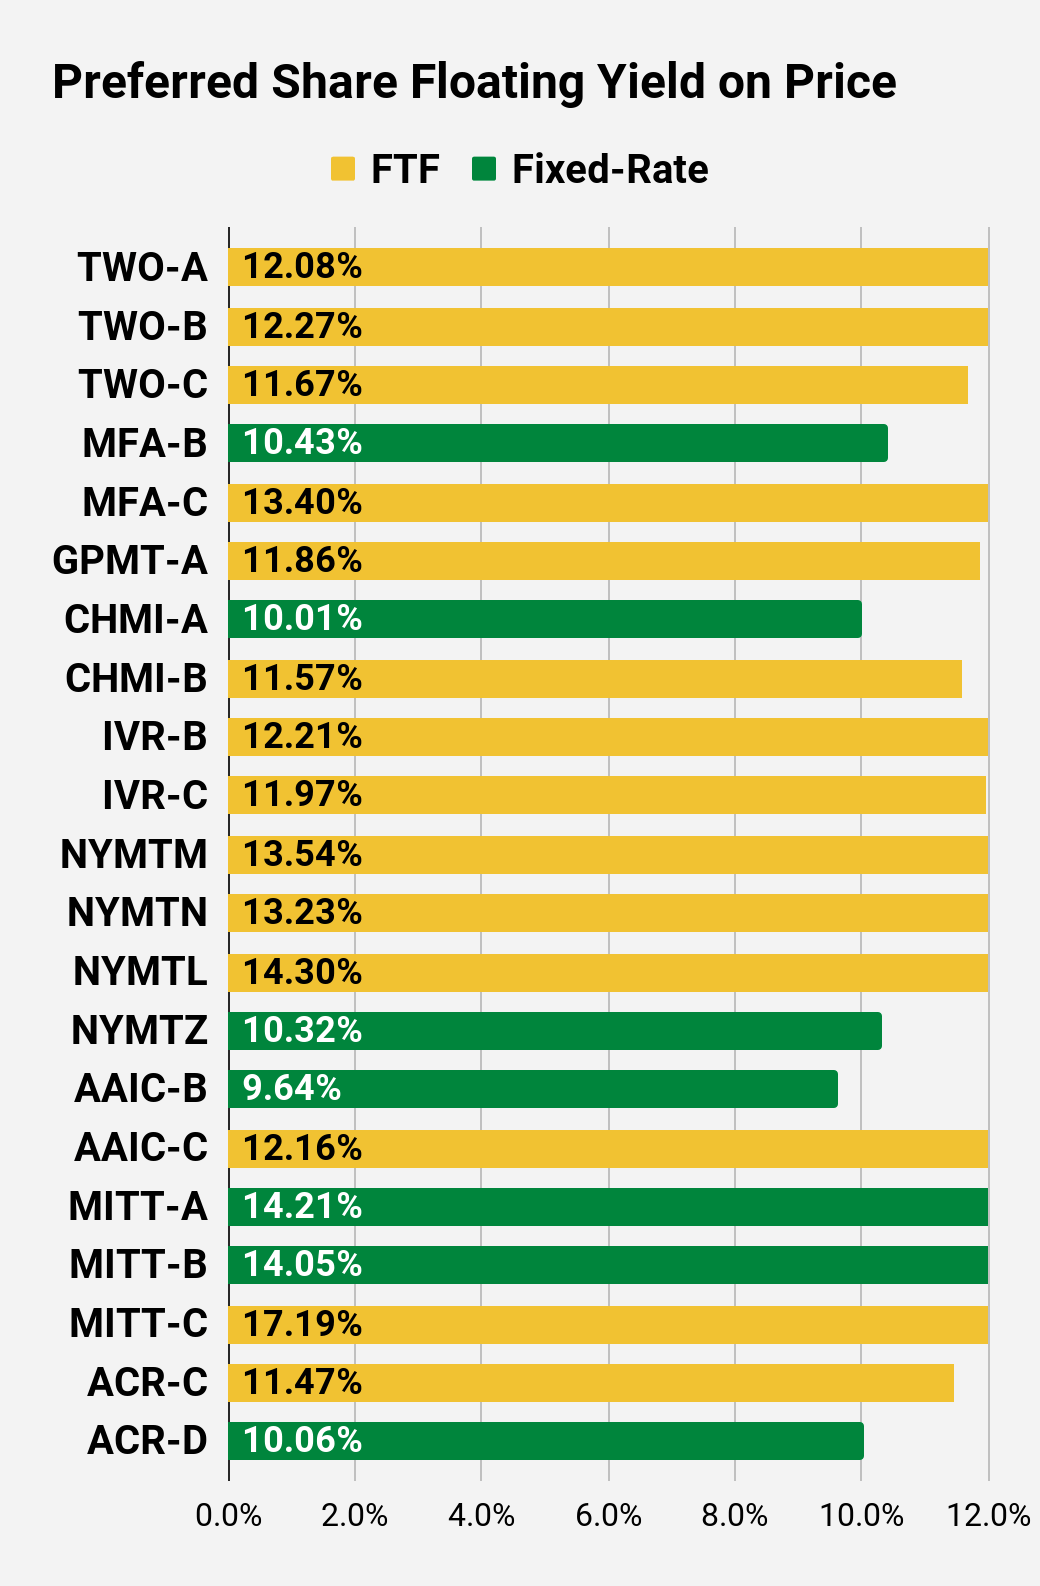
Preferred Share Data
Beyond the charts, we’re also providing our readers with access to several other metrics for the preferred shares.
After testing out a series on preferred shares, we decided to try merging it into the series on common shares. After all, we’re still talking about positions in mortgage REITs. We don’t have any desire to cover preferred shares without cumulative dividends, so any preferred shares you see in our column will have cumulative dividends. You can verify that by using Quantum Online. We’ve included the links in the table below.
To better organize the table, we needed to abbreviate column names as follows:
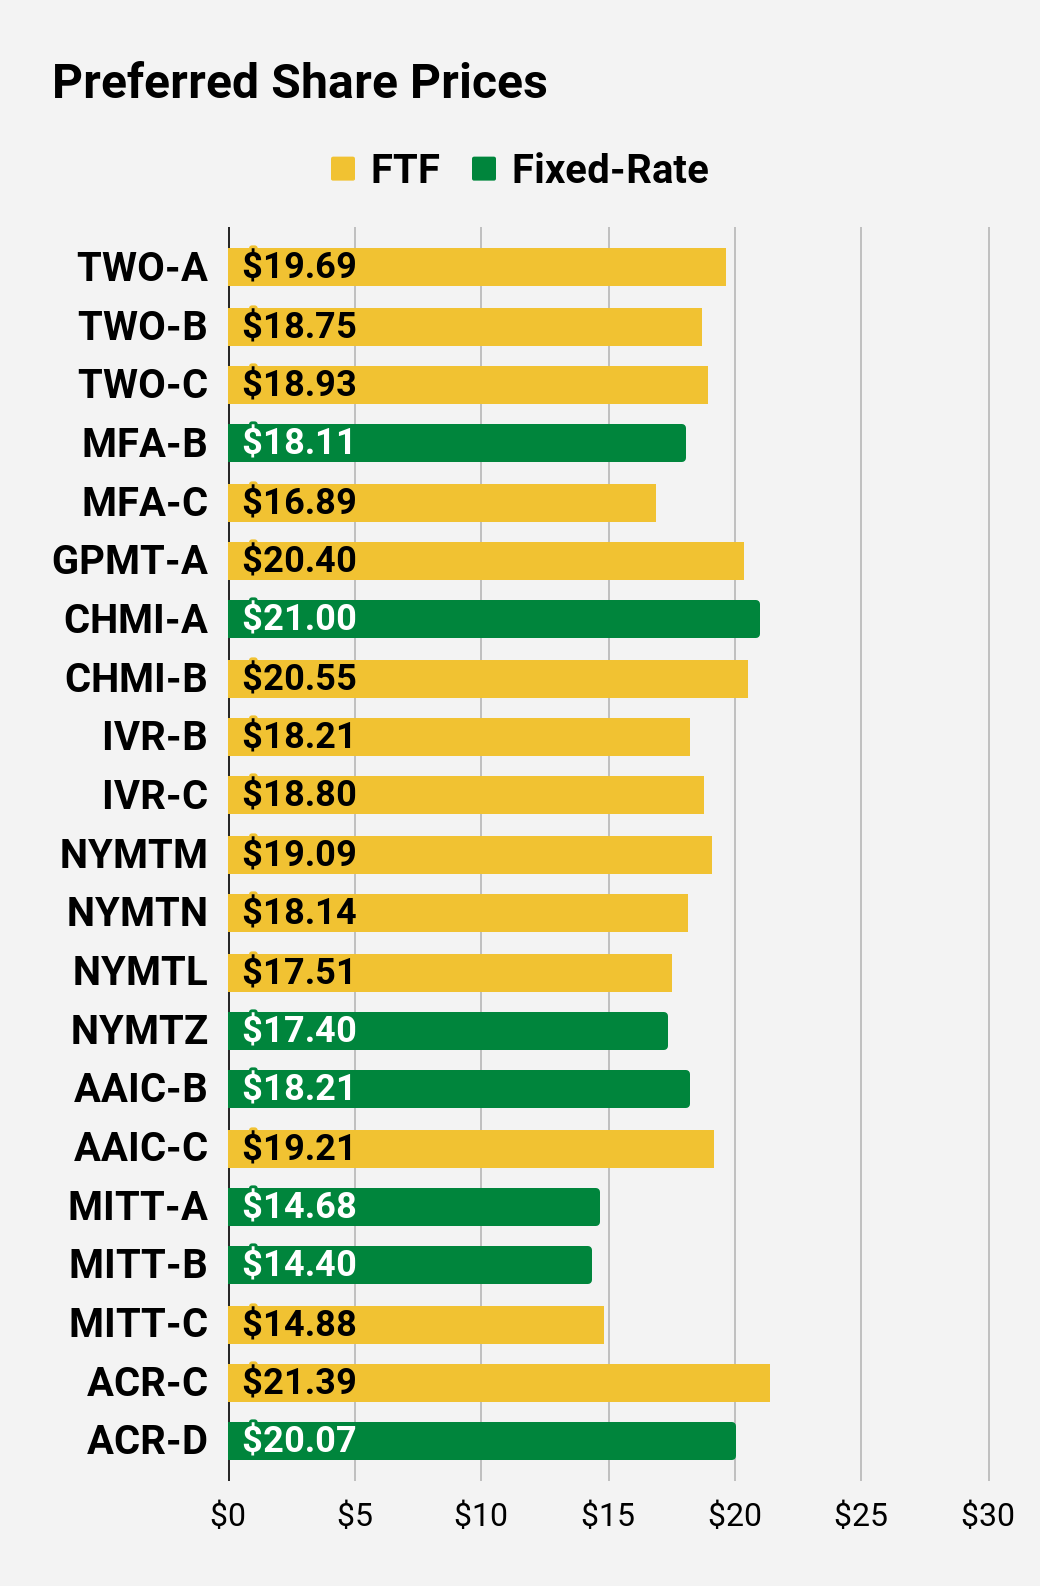
- Price = Recent Share Price – Shown in Charts
- BoF = Bond or FTF (Fixed-to-Floating)
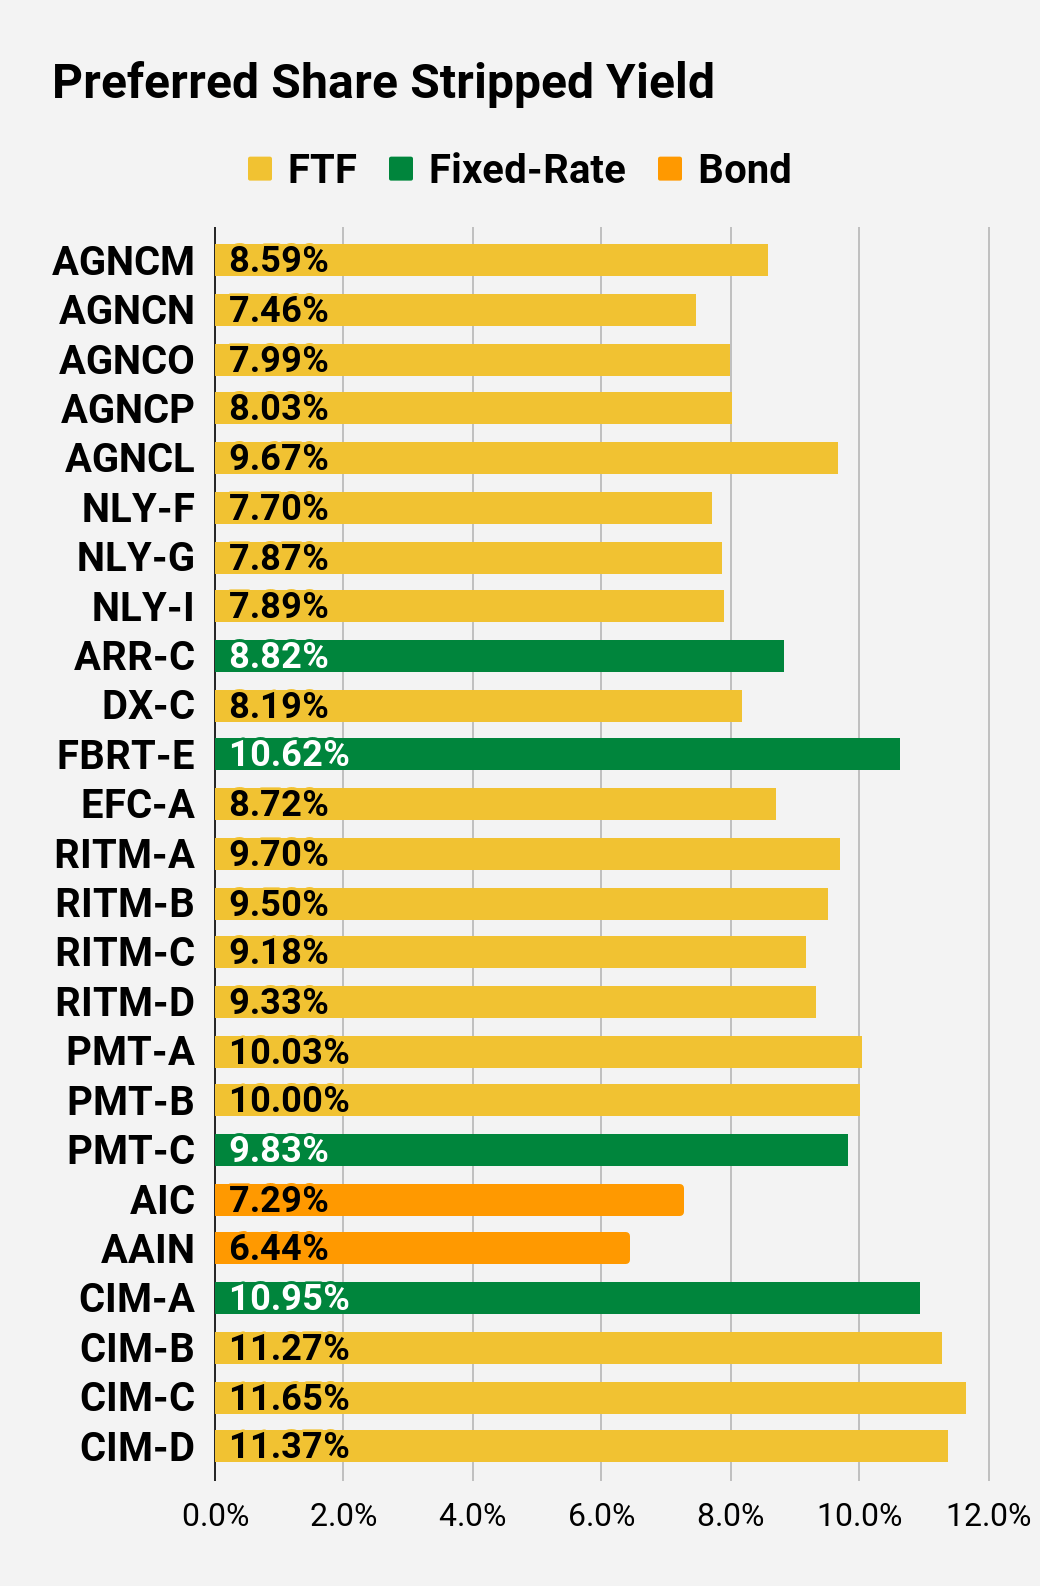
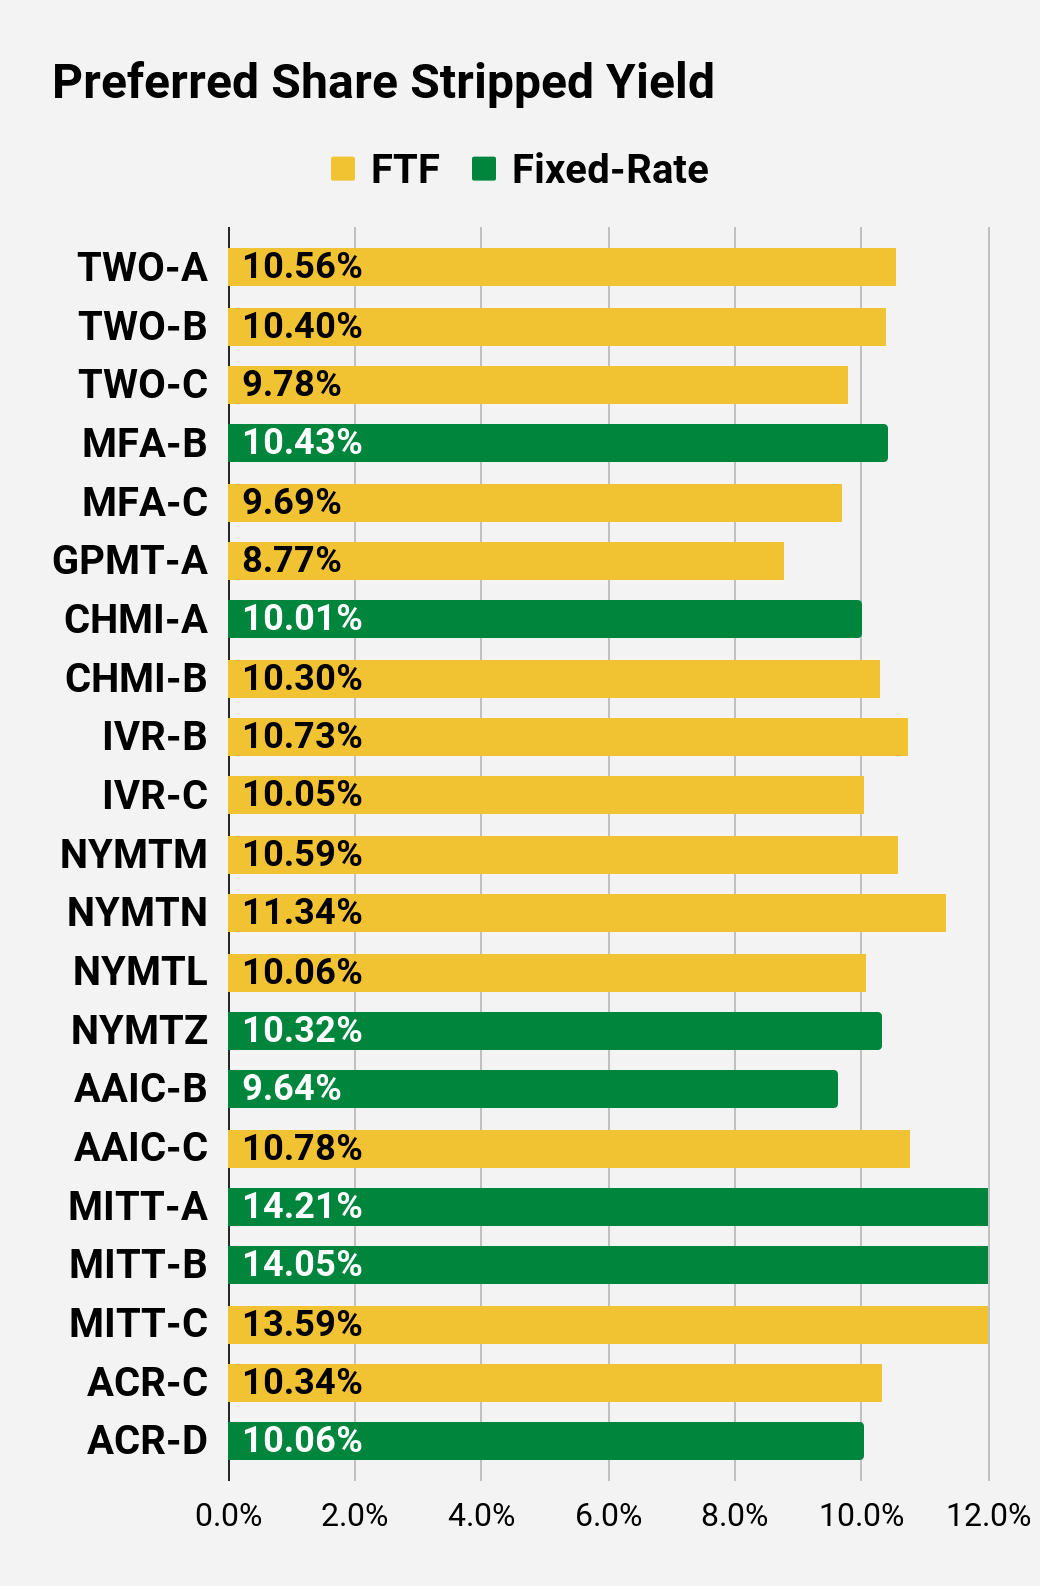
- S-Yield = Stripped Yield – Shown in Charts
- Coupon = Initial Fixed-Rate Coupon
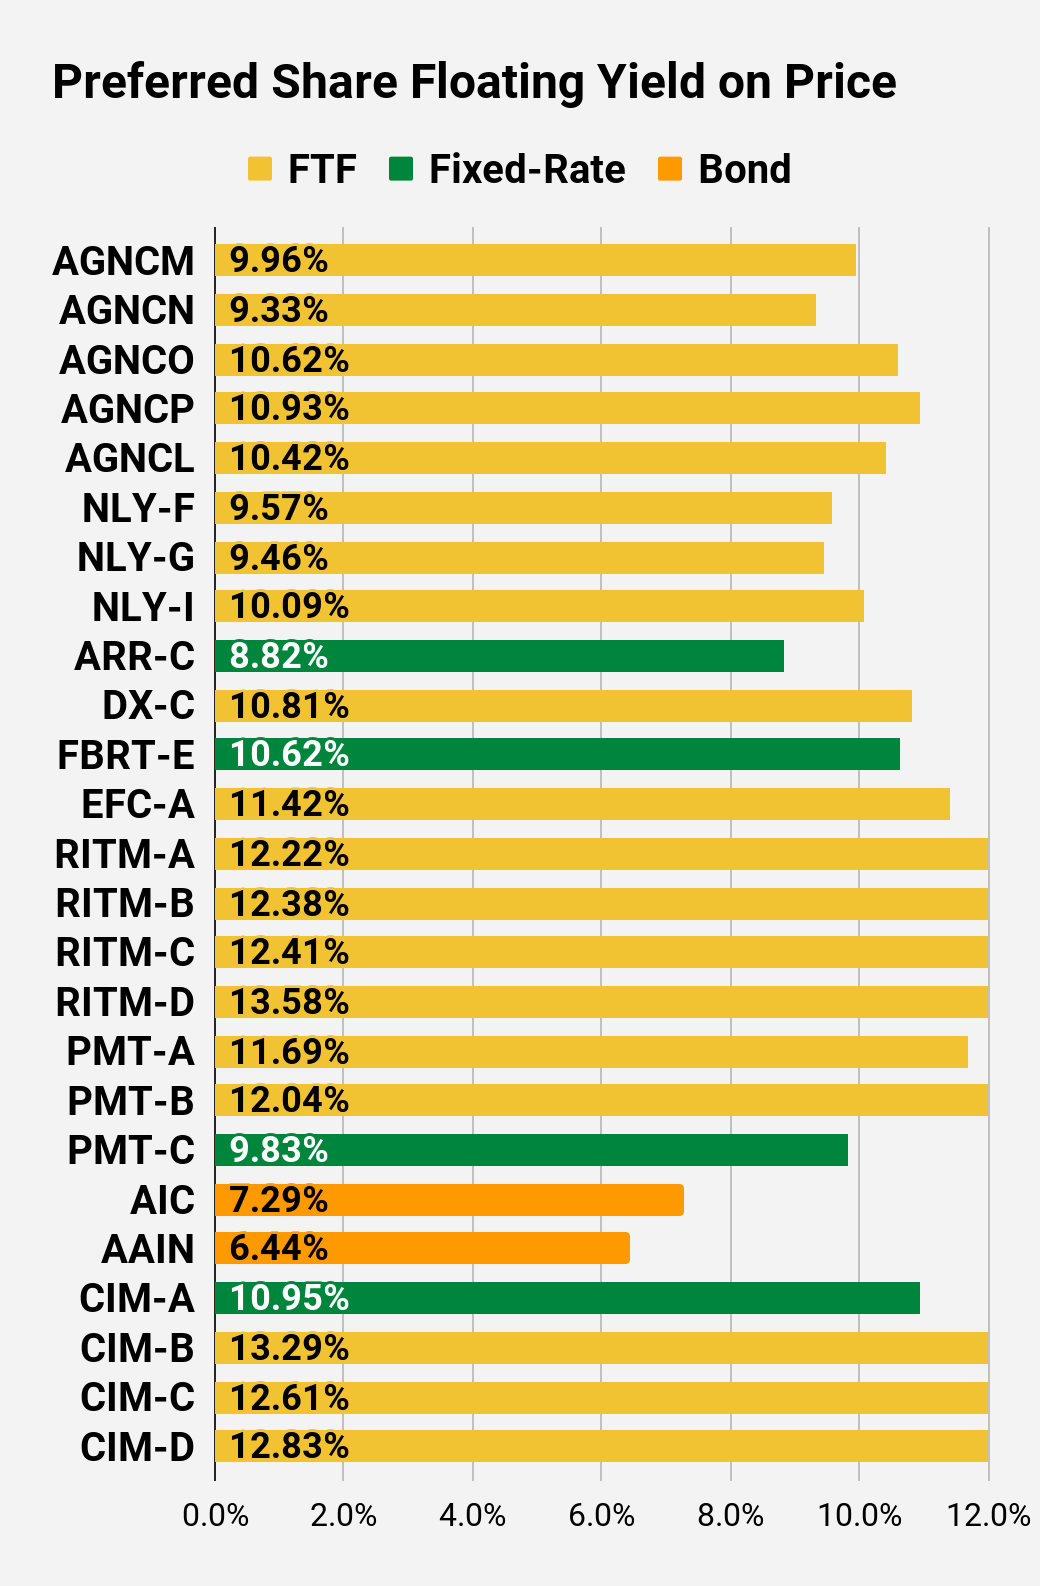
- FYoP = Floating Yield on Price – Shown in Charts
- NCD = Next Call Date (the soonest shares could be called)
- Note: For all FTF issues, the floating rate would start on NCD.
- WCC = Worst Cash to Call (lowest net cash return possible from a call)
- QO Link = Link to Quantum Online Page
| Ticker | Price | BoF | S-Yield | Coupon | FYoP | NCD | WCC | QO Link | P-Link |
| AGNCM | $20.45 | FTF | 8.59% | 6.88% | 9.96% | 4/15/2024 | $7.57 | AGNCM | Prospectus |
| AGNCN | $23.89 | FTF | 7.46% | 7.00% | 9.33% | 10/28/2022 | $1.62 | AGNCN | Prospectus |
| AGNCO | $20.74 | FTF | 7.99% | 6.50% | 10.62% | 10/15/2024 | $7.93 | AGNCO | Prospectus |
| AGNCP | $19.45 | FTF | 8.03% | 6.13% | 10.93% | 4/15/2025 | $9.77 | AGNCP | Prospectus |
| AGNCL | $20.19 | FTF | 9.67% | 7.75% | 10.42% | 10/15/2027 | $14.66 | AGNCL | Prospectus |
| NLY-F | $22.69 | FTF | 7.70% | 6.95% | 9.57% | 10/28/2022 | $2.44 | NLY-F | Prospectus |
| NLY-G | $20.78 | FTF | 7.87% | 6.50% | 9.46% | 3/31/2023 | $5.03 | NLY-G | Prospectus |
| NLY-I | $21.52 | FTF | 7.89% | 6.75% | 10.09% | 6/30/2024 | $6.43 | NLY-I | Prospectus |
| ARR-C | $19.90 | 8.82% | 7.00% | 8.82% | 1/28/2025 | $9.18 | ARR-C | Prospectus | |
| DX-C | $21.49 | FTF | 8.19% | 6.90% | 10.81% | 4/15/2025 | $8.25 | DX-C | Prospectus |
| FBRT-E | $18.13 | 10.62% | 7.50% | 10.62% | 10/28/2022 | $7.41 | FBRT-E | Prospectus | |
| EFC-A | $19.77 | FTF | 8.72% | 6.75% | 11.42% | 10/30/2024 | $9.11 | EFC-A | Prospectus |
| RITM-A | $19.72 | FTF | 9.70% | 7.50% | 12.22% | 8/15/2024 | $9.05 | RITM-A | Prospectus |
| RITM-B | $19.12 | FTF | 9.50% | 7.13% | 12.38% | 8/15/2024 | $9.46 | RITM-B | Prospectus |
| RITM-C | $17.69 | FTF | 9.18% | 6.38% | 12.41% | 2/15/2025 | $11.32 | RITM-C | Prospectus |
| RITM-D | $19.12 | FTF | 9.33% | 7.00% | 13.58% | 11/15/2026 | $13.34 | RITM-D | Prospectus |
| PMT-A | $20.41 | FTF | 10.03% | 8.13% | 11.69% | 3/15/2024 | $7.64 | PMT-A | Prospectus |
| PMT-B | $20.15 | FTF | 10.00% | 8.00% | 12.04% | 6/15/2024 | $8.35 | PMT-B | Prospectus |
| PMT-C | $17.30 | 9.83% | 6.75% | 9.83% | 8/24/2026 | $14.35 | PMT-C | Prospectus | |
| AIC | $23.27 | Bond | 7.29% | 6.75% | 7.29% | 10/28/2022 | $1.92 | AIC | Prospectus |
| AAIN | $23.60 | Bond | 6.44% | 6.00% | 6.44% | 8/1/2023 | $2.90 | AAIN | Prospectus |
| CIM-A | $18.42 | 10.95% | 8.00% | 10.95% | 10/28/2022 | $6.82 | CIM-A | Prospectus | |
| CIM-B | $17.90 | FTF | 11.27% | 8.00% | 13.29% | 3/30/2024 | $10.18 | CIM-B | Prospectus |
| CIM-C | $16.78 | FTF | 11.65% | 7.75% | 12.61% | 9/30/2025 | $14.12 | CIM-C | Prospectus |
| CIM-D | $17.74 | FTF | 11.37% | 8.00% | 12.83% | 03/30/2024 | $10.34 | CIM-D | Prospectus |
Second Batch:
| Ticker | Price | BoF | S-Yield | Coupon | FYoP | NCD | WCC | QO Link | P-Link |
| TWO-A | $19.69 | FTF | 10.56% | 8.13% | 12.08% | 04/27/2027 | $14.96 | TWO-A | Prospectus |
| TWO-B | $18.75 | FTF | 10.40% | 7.63% | 12.27% | 07/27/2027 | $15.79 | TWO-B | Prospectus |
| TWO-C | $18.93 | FTF | 9.78% | 7.25% | 11.67% | 1/27/2025 | $10.61 | TWO-C | Prospectus |
| MFA-B | $18.11 | 10.43% | 7.50% | 10.43% | 10/28/2022 | $7.03 | MFA-B | Prospectus | |
| MFA-C | $16.89 | FTF | 9.69% | 6.50% | 13.40% | 3/31/2025 | $12.17 | MFA-C | Prospectus |
| GPMT-A | $20.40 | FTF | 8.77% | 7.00% | 11.86% | 11/30/2026 | $12.25 | GPMT-A | Prospectus |
| CHMI-A | $21.00 | 10.01% | 8.20% | 10.01% | 10/28/2022 | $4.52 | CHMI-A | Prospectus | |
| CHMI-B | $20.55 | FTF | 10.30% | 8.25% | 11.57% | 4/15/2024 | $7.99 | CHMI-B | Prospectus |
| IVR-B | $18.21 | FTF | 10.73% | 7.75% | 12.21% | 12/27/2024 | $11.17 | IVR-B | Prospectus |
| IVR-C | $18.80 | FTF | 10.05% | 7.50% | 11.97% | 9/27/2027 | $15.60 | IVR-C | Prospectus |
| NYMTM | $19.09 | FTF | 10.59% | 7.88% | 13.54% | 1/15/2025 | $10.84 | NYMTM | Prospectus |
| NYMTN | $18.14 | FTF | 11.34% | 8.00% | 13.23% | 10/15/2027 | $17.36 | NYMTN | Prospectus |
| NYMTL | $17.51 | FTF | 10.06% | 6.88% | 14.30% | 10/15/2026 | $14.80 | NYMTL | Prospectus |
| NYMTZ | $17.40 | 10.32% | 7.00% | 10.32% | 1/15/2027 | $15.48 | NYMTZ | Prospectus | |
| AAIC-B | $18.21 | 9.64% | 7.00% | 9.64% | 10/28/2022 | $6.85 | AAIC-B | Prospectus | |
| AAIC-C | $19.21 | FTF | 10.78% | 8.25% | 12.16% | 3/30/2024 | $8.79 | AAIC-C | Prospectus |
| MITT-A | $14.68 | 14.21% | 8.25% | 14.21% | 10/28/2022 | $10.51 | MITT-A | Prospectus | |
| MITT-B | $14.40 | 14.05% | 8.00% | 14.05% | 10/28/2022 | $10.79 | MITT-B | Prospectus | |
| MITT-C | $14.88 | FTF | 13.59% | 8.00% | 17.19% | 9/17/2024 | $14.09 | MITT-C | Prospectus |
| ACR-C | $21.39 | FTF | 10.34% | 8.63% | 11.47% | 7/30/2024 | $7.93 | ACR-C | Prospectus |
| ACR-D | $20.07 | 10.06% | 7.88% | 10.06% | 5/21/2026 | $12.44 | ACR-D | Prospectus |
Strategy
Our goal is to maximize total returns. We achieve those most effectively by including “trading” strategies. We regularly trade positions in the mortgage REIT common shares and BDCs because:
- Prices are inefficient.
- Long term, share prices generally revolve around book value.
- Short term, price-to-book ratios can deviate materially.
- Book value isn’t the only step in analysis, but it’s the cornerstone.
We also allocate to preferred shares and equity REITs. We encourage buy-and-hold investors to consider using more preferred shares and equity REITs.
Performance
We compare our performance against four ETFs that investors might use for exposure to our sectors:
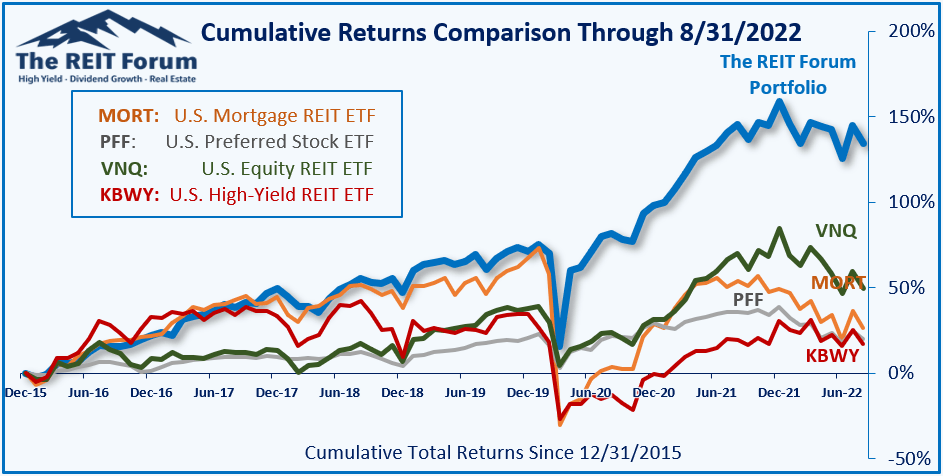
The four ETFs we use for comparison are:
| Ticker | Exposure |
| MORT | One of the largest mortgage REIT ETFs |
| PFF | One of the largest preferred share ETFs |
| VNQ | Largest equity REIT ETF |
| KBWY | The high-yield equity REIT ETF. Yes, it has been dreadful. |
When investors think it isn’t possible to earn solid returns in preferred shares or mortgage REITs, we politely disagree. The sector has plenty of opportunities, but investors still need to be wary of the risks. We can’t simply reach for yield and hope for the best. When it comes to common shares, we need to be even more vigilant to protect our principal by regularly watching prices and updating estimates for book value and price targets.
Ratings:
Photo by Herry Sutanto on Unsplash