
Summary
- Vanguard Dividend Appreciation Index Fund ETF Shares is the best aristocrat and future aristocrat ETF I’ve ever found, with a perfect dividend growth record of 16 years without an annual dividend cut.
- Not even ProShares S&P 500 Dividend Aristocrats ETF, a pure aristocrat ETF, has such dependable and strong dividend growth.
- VIG is as close to a pure Super/Ultra SWAN ETF as I’ve ever found, a potentially great single ticker retirement plan for anyone comfortable with 100% stock portfolio volatility.
- Vanguard International Dividend Appreciation Index Fund ETF Shares is the international version of VIG and includes some of the highest quality and financially strongest companies on earth. Their free cash flow yield of 25% is as good as Apple’s.
- VIGI includes many world beaters and is a worthy rival for VIG. This article compares and contrasts the holdings, sector allocations, financials, valuation, growth potential, and historical dividend growth. The conclusion is clear; one of these exchange-traded funds is the best dividend aristocrat ETF you can buy today.
How World-Beater ETFs Can Change Your Life
The Dividend Kings ZEUS Income Growth Portfolio
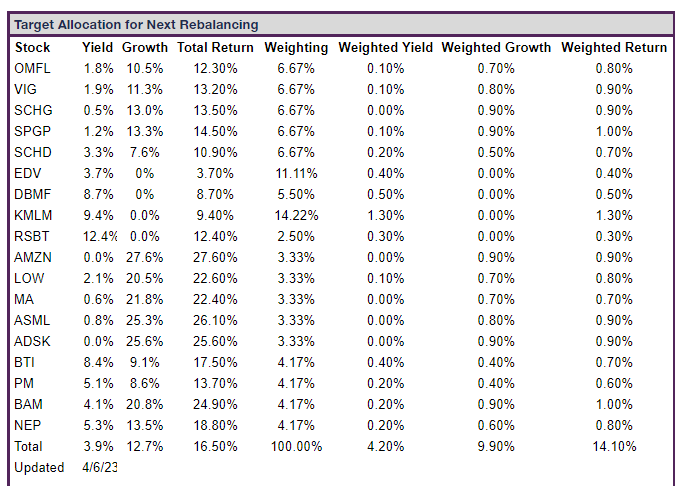
This is the target allocation of the DK ZEUS Income Growth portfolio, which is what my family’s $2.3 million portfolio is building towards.
Not only does it offer a wonderful 4.2% yield, but its historical and future return potential of 14% is superior to almost any popular exchange-traded fund (“ETF”) or mutual fund, such as the S&P, aristocrats, Schwab U.S. Dividend Equity ETF™ (SCHD
| Bear Market | ZEUS Income Growth Peak Decline | 60/40 Peak Decline | S&P Peak Decline | Nasdaq Peak Decline |
| 2022 Stagflation | -11% | -21% | -28% | -35% |
| Pandemic Crash | -10% | -13% | -34% | -13% |
| 2018 Recession Scare | -13% | -9% | -21% | -17% |
| 2011 Debt Ceiling Crisis | -1% | -16% | -22% | -11% |
| Great Recession | -24% | -44% | -58% | -59% |
| Average | -12% | -21% | -33% | -27% |
| Median | -11% | -16% | -28% | -17% |
(Source: DK Research Terminal.)
Great yield, incredible long-term returns, and volatility so low it’s like riding over even the most extreme market potholes in a limousine.
The key to such an extraordinary portfolio is asset allocation.
- 18 World-Beater Blue Chips For The Ultimate High-Yield Retirement Portfolio
- An introduction to what makes the ZEUS strategy work.
90% of long-term returns are determined by asset allocation or the mix of stocks, bonds, and alternative assets you own.
- The golden ratio of assets is what makes the magic work.
33% ETFs, 33% hedges, and 33% individual stocks is the ZEUS ratio, and among those ETFs, we have five of my favorite ETFs.
Three are core ETFs, meaning their holdings are relatively stable over time.
The other two ETFs, SPGP (
- SPGP: the Super GARP ETF (high-quality deep value growth)
- OMFL: multi-factor ETF that adapts to the current economic cycle.
I’m constantly looking for new world-beater ETFs that I can add to the ETF bucket that might improve the portfolio’s fundamentals (yield, growth, and total return potential).
- ZEUS average ETF: 1.7% yield, 11.2% growth, and 12.9% total return consensus.
It’s a high bar to clear to earn a spot in ZEUS.
Historical Returns Since 2017
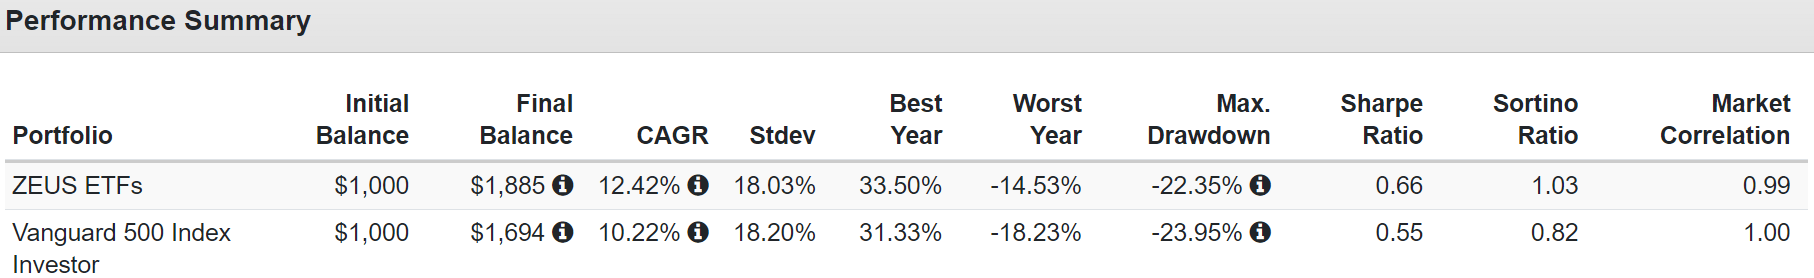
How realistic are 13% returns from these five ETFs? Well for the last six years that’s pretty much what they have delivered, with market-beating returns in a raging bull market.
I recently compared and contrasted SCHD and Schwab International Dividend Equity ETF (SCHY
Today per the request of several Dividend Kings members, I’m looking at the international version of Vanguard Dividend Appreciation Index Fund ETF Shares (NYSEARCA:VIG
Introducing VIGI, The International Version Of VIG
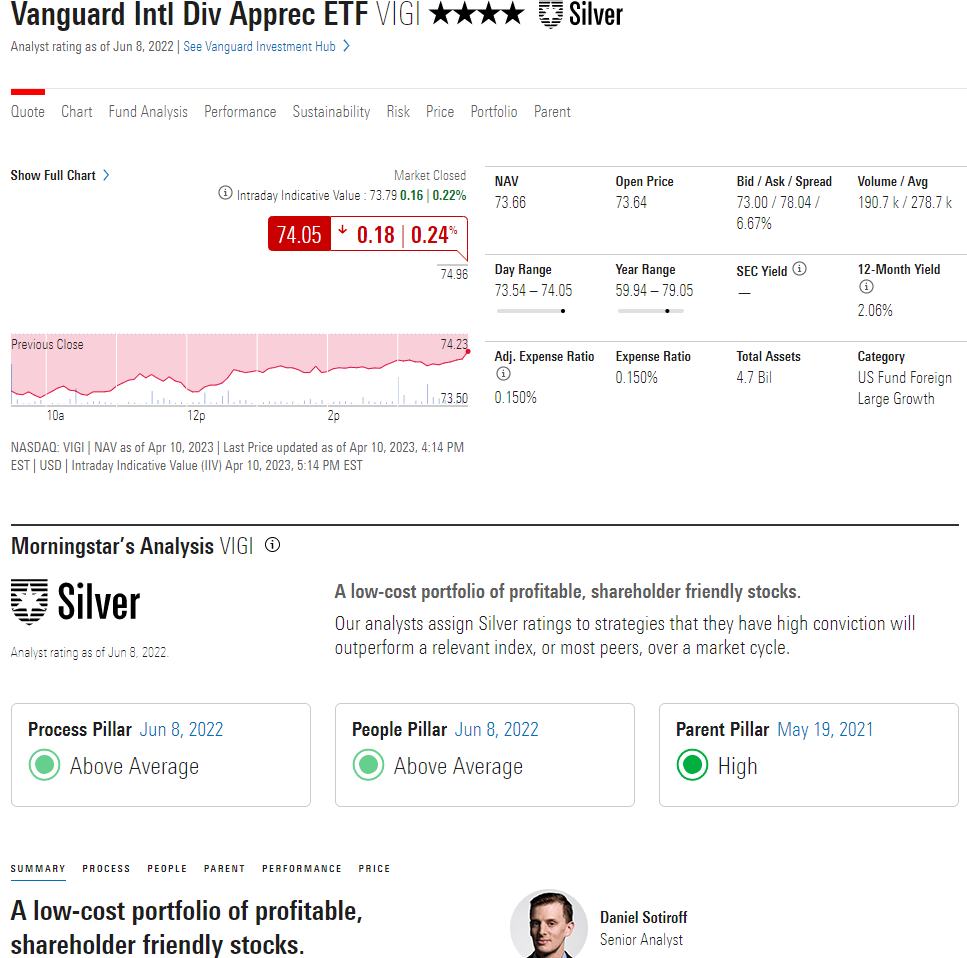
The Vanguard International Dividend Appreciation Index Fund ETF Shares (NASDAQ:VIGI
How does this ETF work?
This fund tracks the S&P International Dividend Growers Index, a well-diversified bogy that looks for stocks with at least seven consecutive years of increasing dividend payments. It avoids those likely to cut their dividend payments by excluding the highest-yielding names in the dividend growth cohort. The portfolio weights stocks that make the cut by their float-adjusted market cap, which captures the market’s collective opinion of each company’s value while keeping turnover and trading costs in check.” – Morningstar.
VIG uses a 10-year dividend growth streak as its cutoff, and VIGI uses a seven-year cutoff.
Targeting stocks with seven years of dividend growth is a strict hurdle that provides a big advantage. It indirectly targets profitable companies with the capacity to make dividend payments and a willingness to do so. This screen has its downsides. It doesn’t consider other metrics, such as debt levels and analyst earnings growth estimates, which may indicate a firm’s capacity to continue making payments. Additionally, if a company were to miss a single dividend payment, it must wait seven years before it is welcomed back.” – Morningstar
The downside of this strategy is that those three extra years can make a difference in the overall quality and safety of companies.
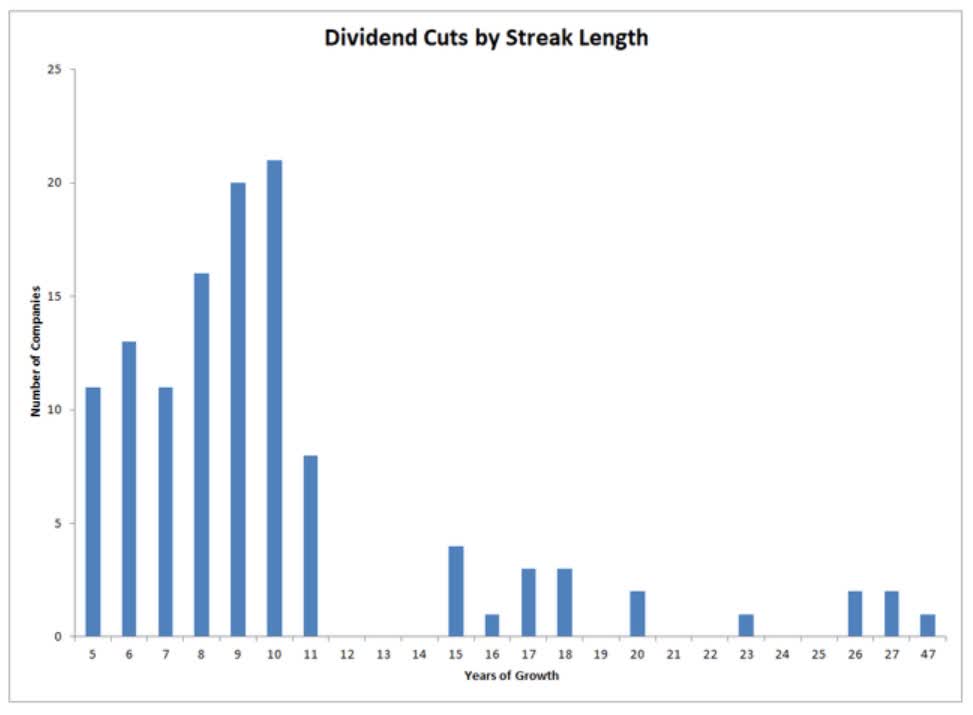
12-years is the statistically significant cutoff for dividend safety during the Pandemic, and seven years still resulted in plenty of dividend cuts (for U.S. stocks) during the Pandemic.
Of course, VIGI now excludes anything that cut its dividend during the Pandemic, but as Morningstar points out, VIGI, like VIG doesn’t have much in terms of secondary quality screens.
- SCHD uses four quality screens in its index
- VIGI just two 7-year streaks and excludes the highest-yielding stocks
Vanguard’s portfolio managers will use full replication to track the S&P International Dividend Growers Index. This benchmark starts with all S&P Global ex-U.S. Broad Market Index stocks, including companies listed in developed and emerging markets. It excludes REITs and firms currently working through bankruptcy proceedings and applies additional liquidity screens to ensure potential holdings are investable.” – Morningstar.
If you want real estate investment trust, or REIT, exposure, you must add those into the individual stock bucket or a REIT ETF.
The methodology narrows its selection to companies with a seven-year history of increasing regular cash dividend payments. The strategy sorts these stocks by their indicated dividend yield and eliminates those landing in the top 25%. This criterion should eliminate stocks that are most likely to cut their dividends, allowing the fund to maintain a tight focus on names that will continue growing their dividends in the future. The index weights constituents by float-adjusted market cap, subject to a 4% maximum weight at the time of the rebalance. The index reconstitutes annually in March and splits its trading activity across three days to reduce the market impact costs of trading.” – Morningstar
The 4% max risk cap is a prudent way of ensuring good diversification.
- most institutions, like pensions, have 5% max risk caps
- even actively managed futures tend to cap positions at 10%.
The exclusion of the top 25% yielding names means that you shouldn’t expect a high yield, just a relatively safer and more steadily growing yield.
The silver rating means that Morningstar’s analysts are confident that VIGI’s portfolio construction strategy is sound and will outperform its peers over time.
The four-star rating is based on historical returns vs. its peers.
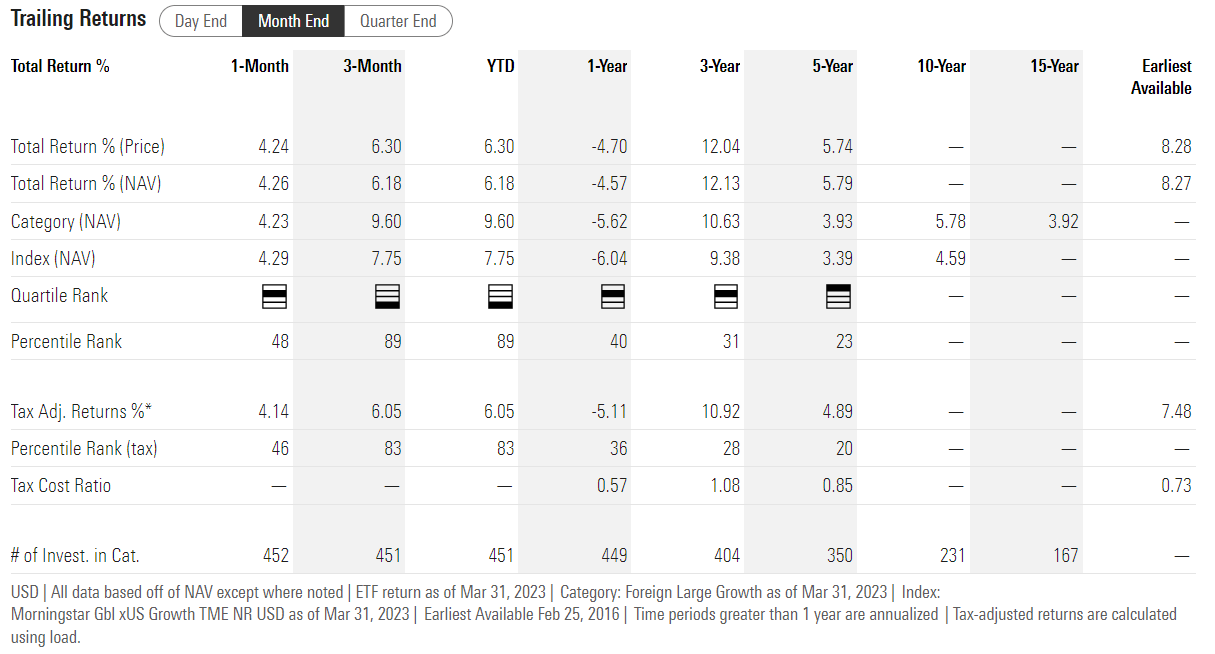
VIGI has been around since early 2016 and has delivered 8.3% annual returns and, over the last five years, was in the top 23% of its peers.
Note that its peers delivered just 3.9% annual returns over the last five years, so its high star rating doesn’t necessarily indicate strong returns, just that it cleared a low bar.
How VIGI Compares To VIG
Let’s walk through what VIGI owns and how that compares to VIG, my single favorite dividend growth ETF.
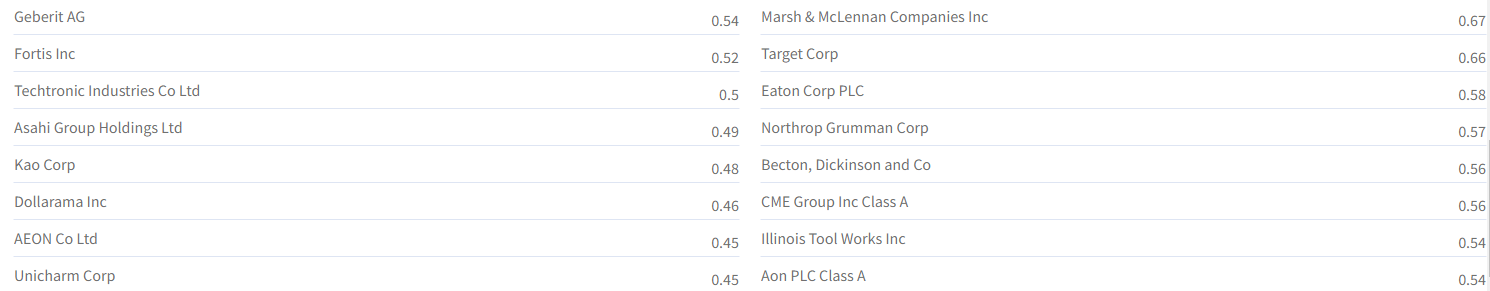
Top 50 Holdings Of VIGI And VIG
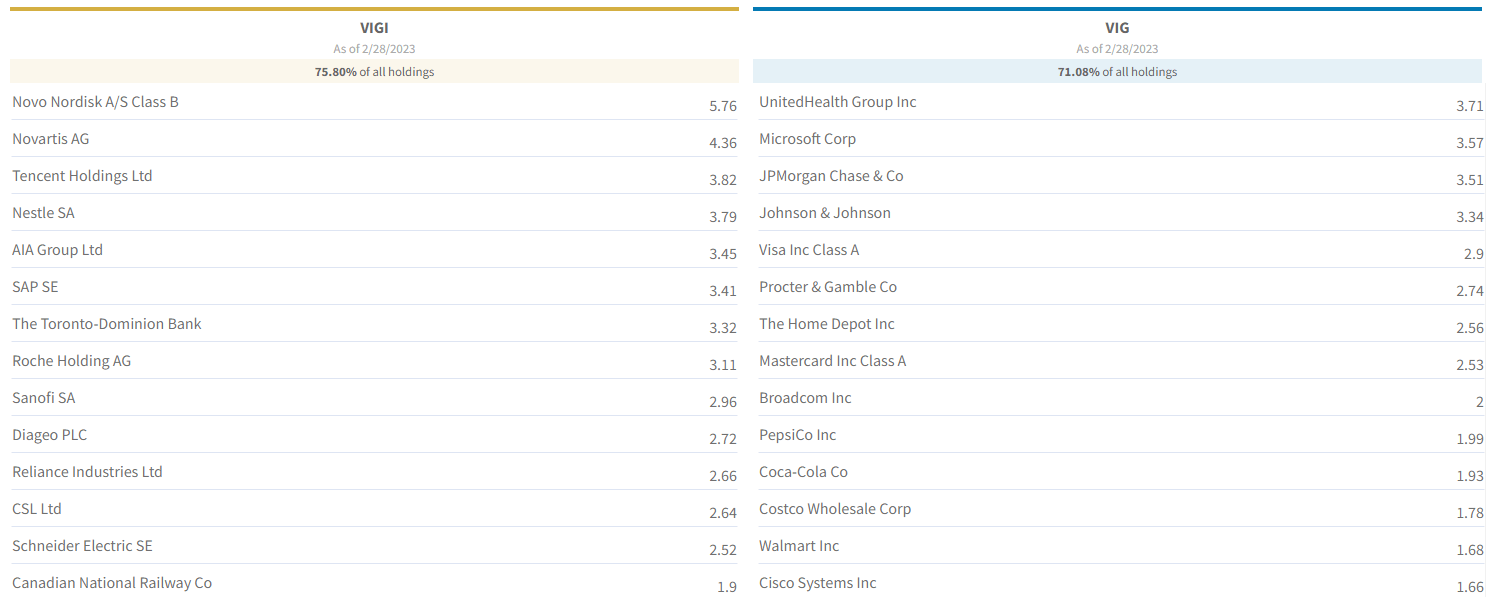
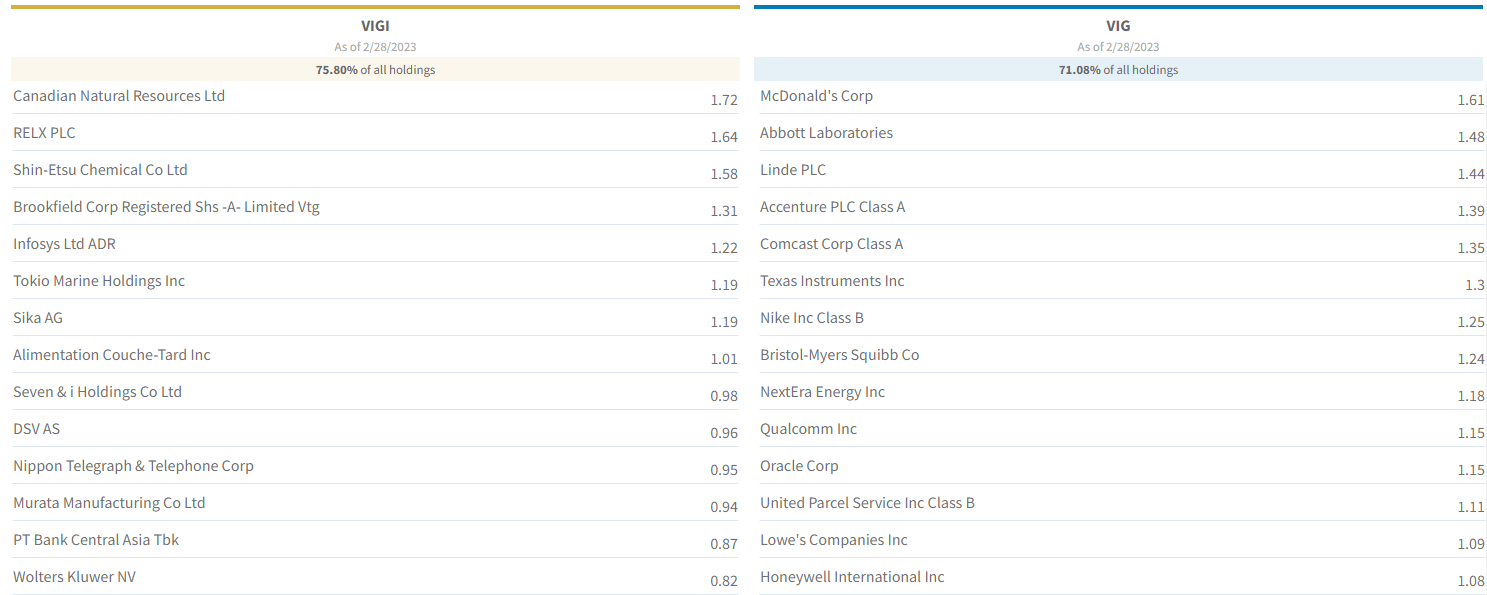

I like that VIGI has some true world-beaters like TD (
The Dividend Kings Master List includes many of these companies, so at first glance, the quality of the companies appears to be very high.
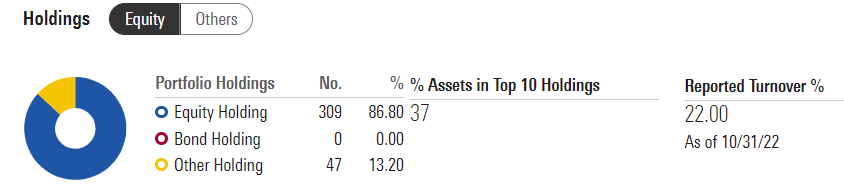
VIGI
VIG
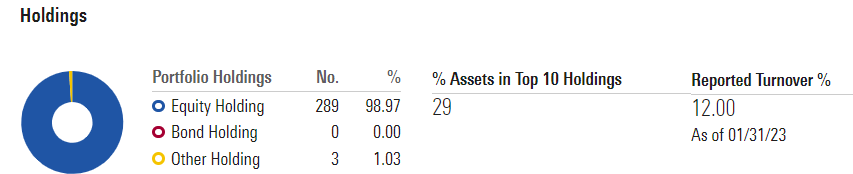
Both are highly diversified ETFs with good diversification and relatively low turnover.
VIGI Geography
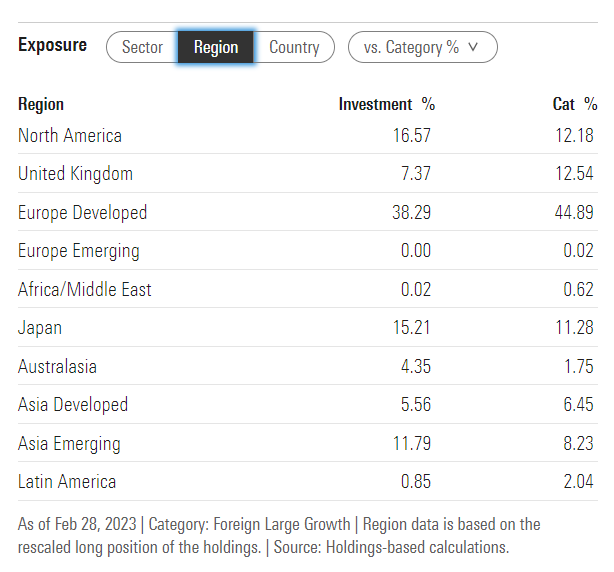
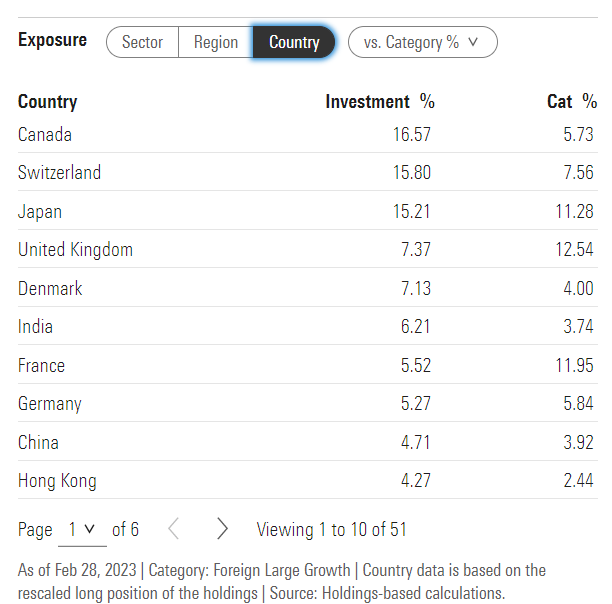
Naturally, VIGI is more internationally diversified, with most exposure focused on Europe, the UK, and North America. It also offers a lot of Asian exposure and 12% emerging markets.
VIGI appears to be a good Canadian and Japanese ETF since its own companies representing the best of each country’s income growth.
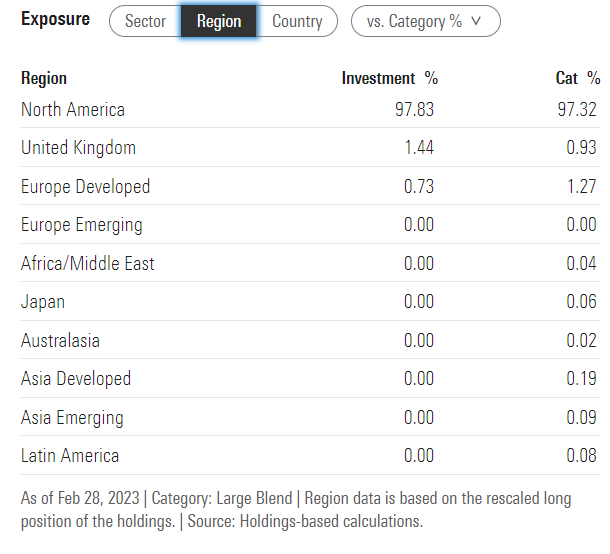
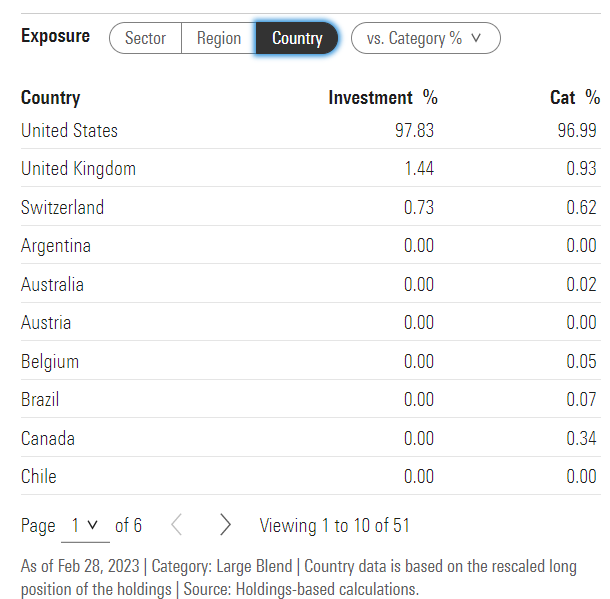
VIG is a U.S.-focused ETF.
VIG Geography
What about sector diversification?
VIGI Sectors
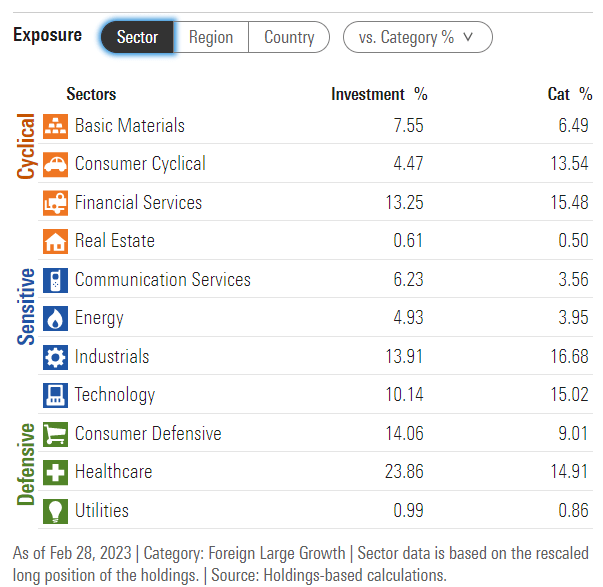
VIGI is a heavily defensive portfolio since those sectors have an easier time delivering dependable dividend growth.
VIG Sectors
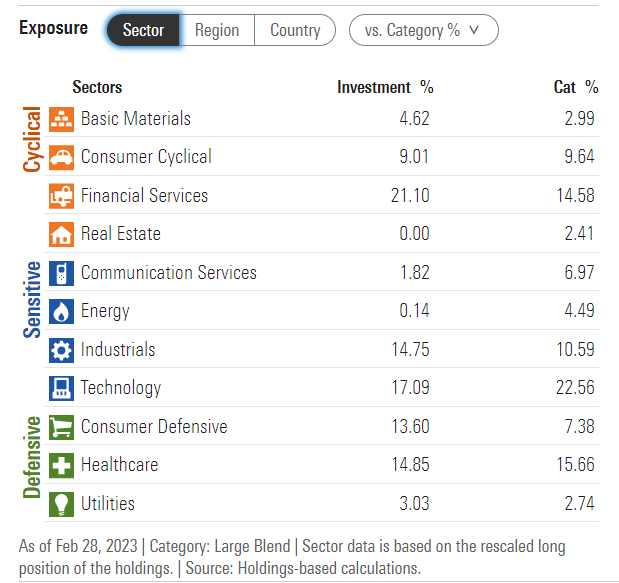
VIG’s largest sector is financials, with less defensive sector allocation in general.
- 7% more tech exposure.
Quality, Growth, And Valuation Comparison
Let’s next compare each ETFs valuation, growth prospects, and quality.
VIGI Valuation
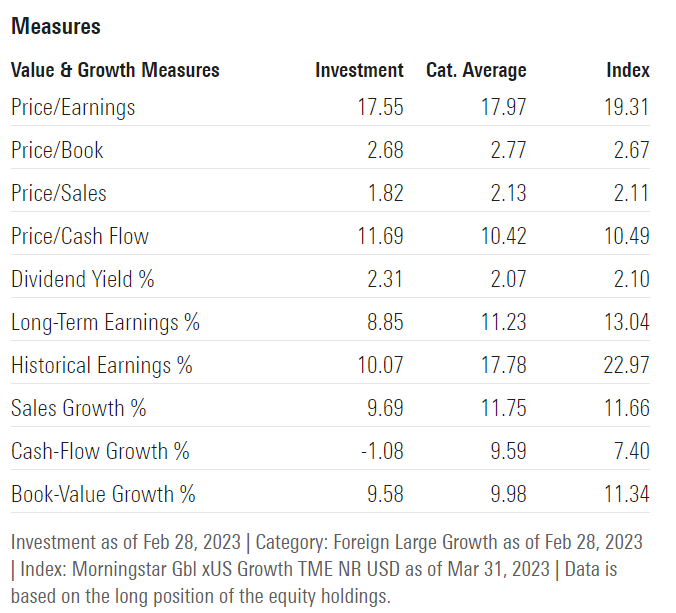
VIGI looks relatively attractively valued, but don’t let that 17.6 P/E fool you.
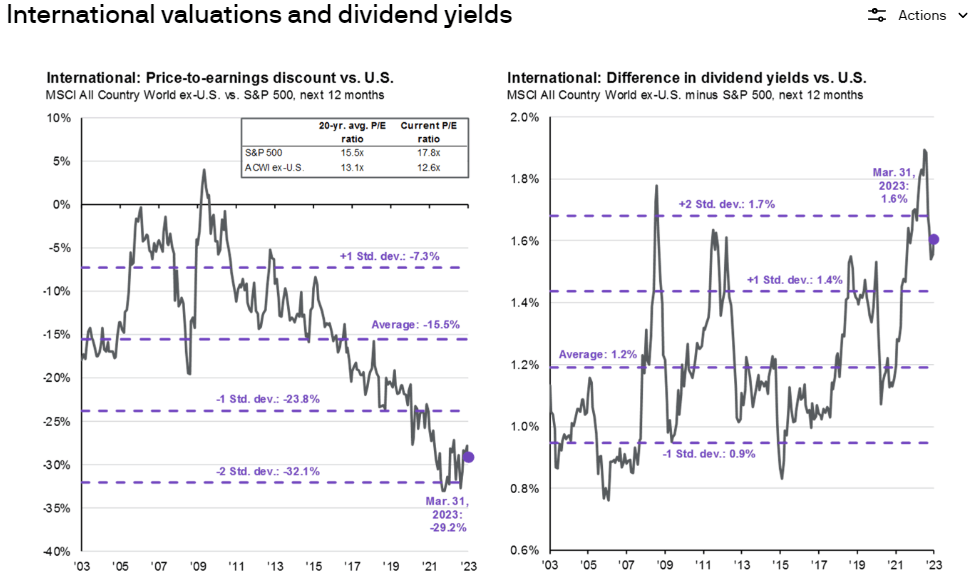
International stocks historically trade at a lower valuation than U.S. stocks, and right now, international is trading at a modest historical discount of 12.6X earnings.
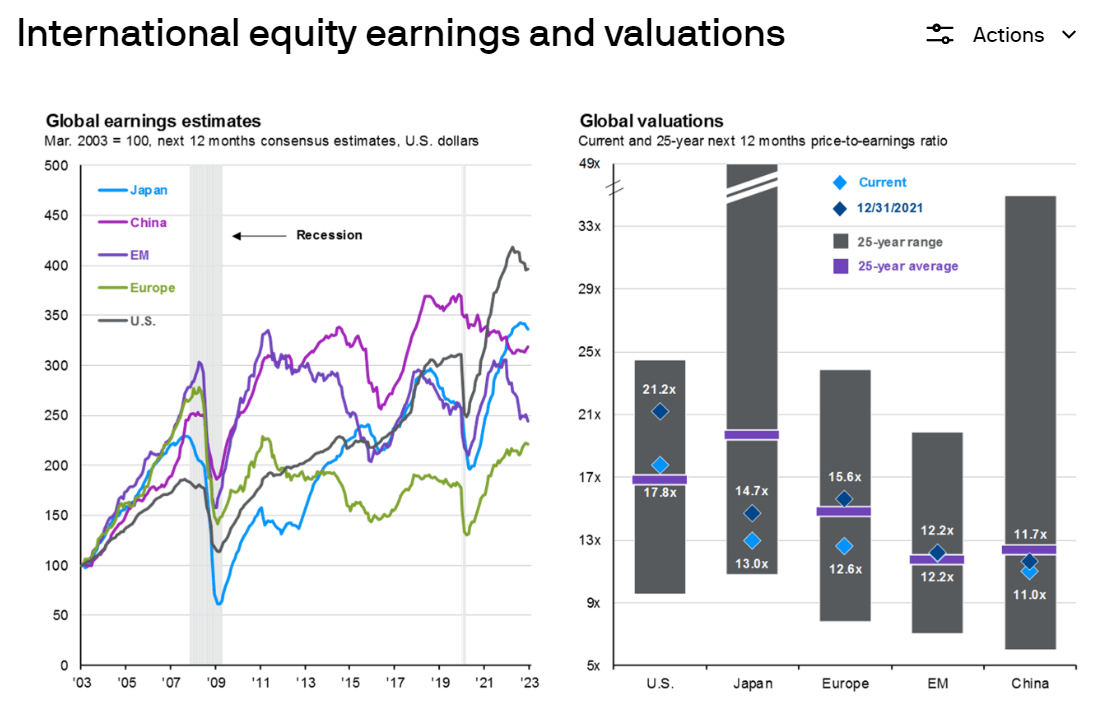
Europe, emerging markets, and Japanese stocks are indeed trading at historical discounts, and VIGI trades at a premium to these broader market indexes.
But remember, its quality is higher, so that premium is likely well deserved.
And an 11.7X cash flow multiple is extremely attractive, meaning VIGI is almost certainly a good deal for anyone buying it today.
VIGI Is 6% Historically Undervalued
| Year | PE |
| 2016 | 20.25 |
| 2017 | 20.12 |
| 2018 | 20.05 |
| 2019 | 19.15 |
| 2020 | 27.84 |
| 2021 | 19.55 |
| 2022 | 19.07 |
| 2023 | 19.07 |
| 2024 | 17.58 |
| 7-Year Average | 20.64 |
| 7-Year Median | 19.80 |
| 5-Year Average | 20.94 |
| 5-Year Median | 19.15 |
| 12-Month Forward | 18.64 |
| Historically Overvalued | -5.86% |
(Source: DK Research Terminal, FactSet.)
VIGI historically trades at 20X earnings, and today is about 6% historically undervalued, a potentially good buy just like VIG.
VIG Valuation
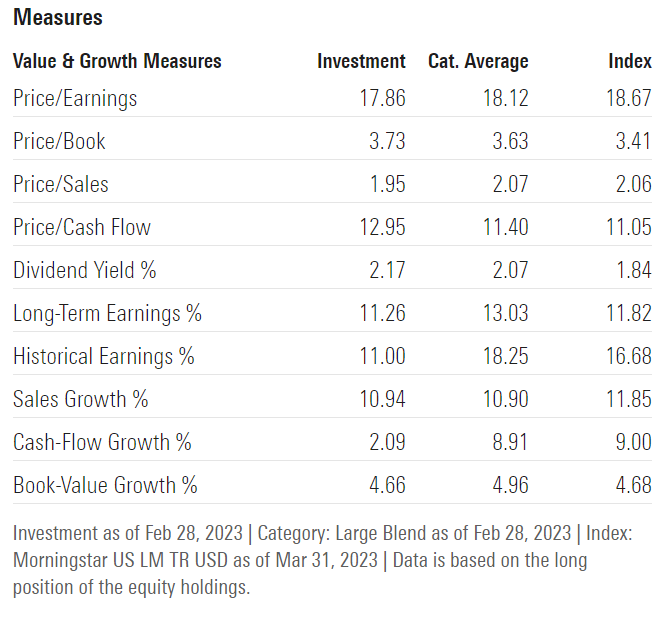
VIG is trading at a similar P/E as VIGI and 13X cash flow.
VIG Is 5% Historically Undervalued
| Year | PE |
| 2008 | 10.23 |
| 2009 | 16.12 |
| 2010 | 15.93 |
| 2011 | 14.87 |
| 2012 | 15.57 |
| 2013 | 17.51 |
| 2014 | 18.38 |
| 2015 | 17.65 |
| 2016 | 21.07 |
| 2017 | 21.76 |
| 2018 | 19.19 |
| 2019 | 20.07 |
| 2020 | 24.83 |
| 2021 | 20.04 |
| 2022 | 18.55 |
| 2023 | 18.55 |
| 2024 | 17.77 |
| 15-Year Average | 16.17 |
| 15-Year Median | 18.38 |
| 10-Year Average | 19.61 |
| 10-Year Median | 19.62 |
| 5-Year Average | 20.54 |
| 5-Year Median | 20.04 |
| 12-Month Forward | 18.55 |
| Historically Overvalued | -5.43% |
(Source: DK Research Terminal, FactSet.)
VIG is modestly undervalued and a potentially good buy right now.
VIGI Quality
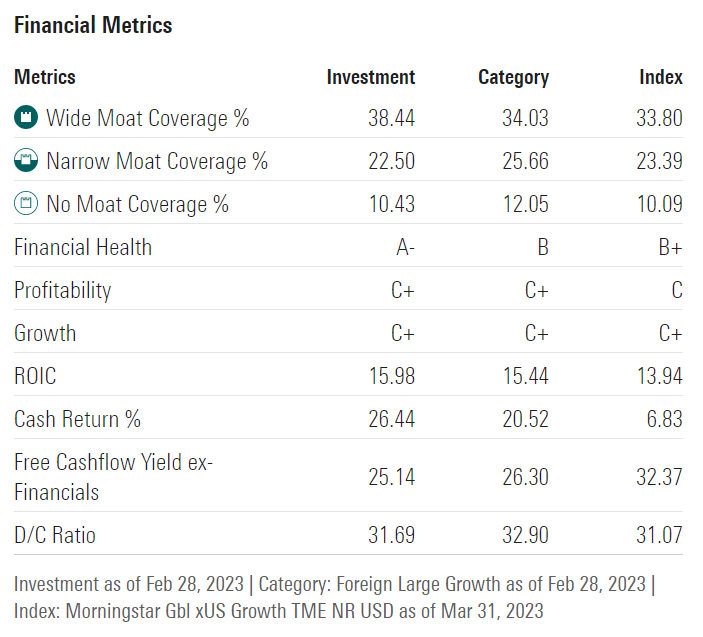
VIGI’s moatiness isn’t that great, but its financial health is immaculate, the best I’ve seen from any ETF.
Its free cash flow yield of 25% is on par with Apple Inc.’s (AAPL
VIG Quality

VIG is one of the widest-moat ETFs on Wall Street, with very strong financial health and slightly better profitability than VIGI.
- 27% free cash flow margin vs. 25%
- 45% payout ratio vs. 33% (still very safe).
Long-Term Total Return Potential
| Investment Strategy | Yield | LT Consensus Growth | LT Consensus Total Return Potential |
| ZEUS Income Growth (My family hedge fund) | 4.2% | 9.9% | 14.1% |
| Vanguard Dividend Appreciation ETF | 2.0% | 11.3% | 13.2% |
| Nasdaq | 0.8% | 11.2% | 12.0% |
| Schwab US Dividend Equity ETF | 3.8% | 7.6% | 11.4% |
| REITs | 3.9% | 7.0% | 10.9% |
| Vanguard International Dividend Appreciation ETF | 2.1% | 8.9% | 10.9% |
| Dividend Aristocrats | 1.9% | 8.5% | 10.4% |
| S&P 500 | 1.7% | 8.5% | 10.2% |
| 60/40 Retirement Portfolio | 2.1% | 5.1% | 7.2% |
(Sources: DK Research Terminal, FactSet, Morningstar.)
VIGI offers solid return potential superior to the dividend aristocrats and S&P 500 (
This makes sense, given that it’s designed around dividend safety and consistency and not necessarily growth.
Historical Dividend Growth
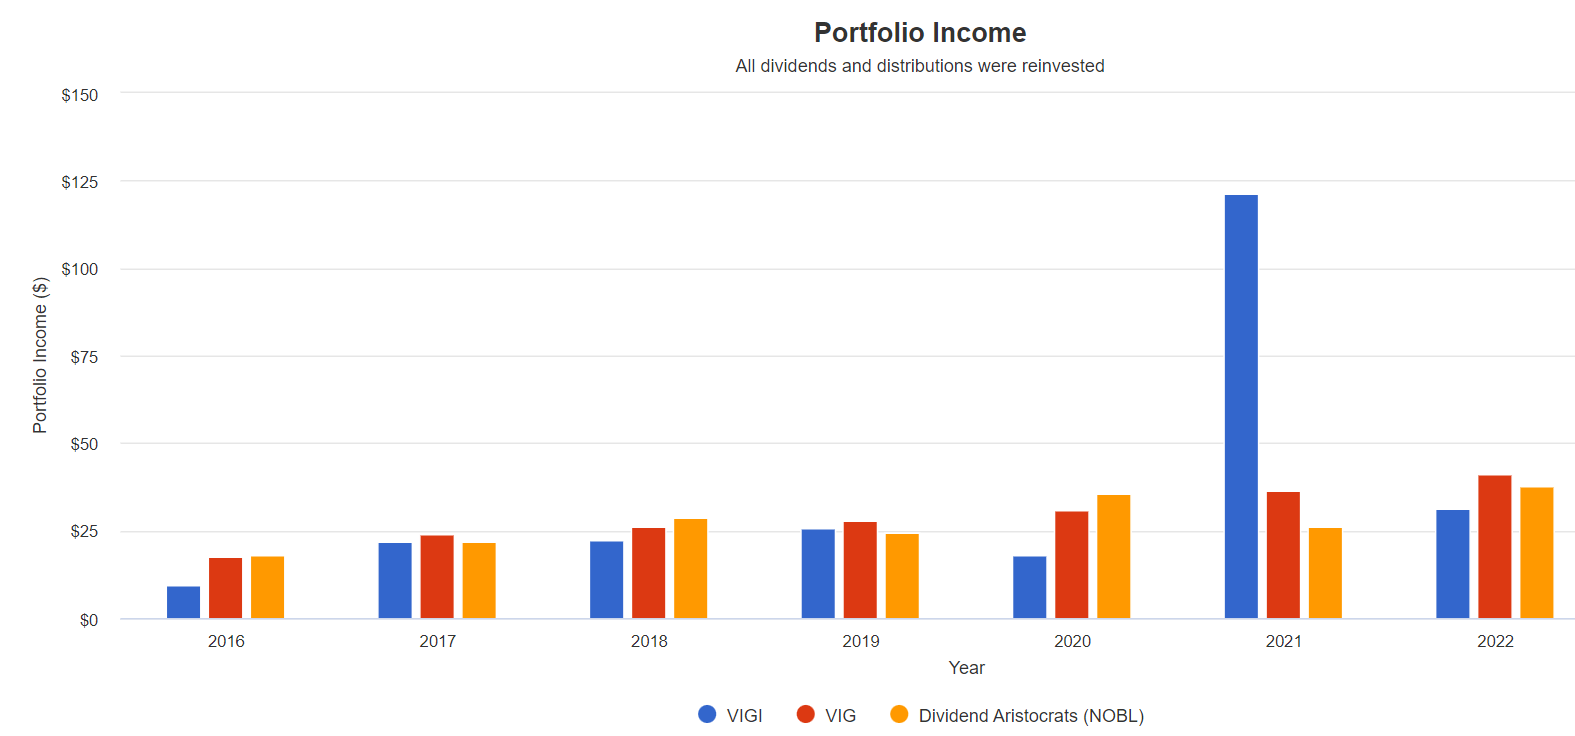
The dividend growth since 2017 (the first full year for VIGI) for these ETFs is as follows:
- VIGI: 5.9% annually
- VIG: 9.3% annually
- NOBL (
: 9.5% annually.
VIGI suffered a 31% dividend cut in 2020, while VIG saw 11% growth.
In 2022 VIG’s dividends grew 14%, while VIGI’s crashed due to a special dividend in 2021.
VIG is famous for being the only ETF I know of to never cut its annual dividend (something not even NOBL can claim) since its 2008 inception.
- VIG dividends were flat in the Great Recession.
In other words, regarding dividend dependability, VIG remains the king of ETFs.
Historical Returns Since 2016
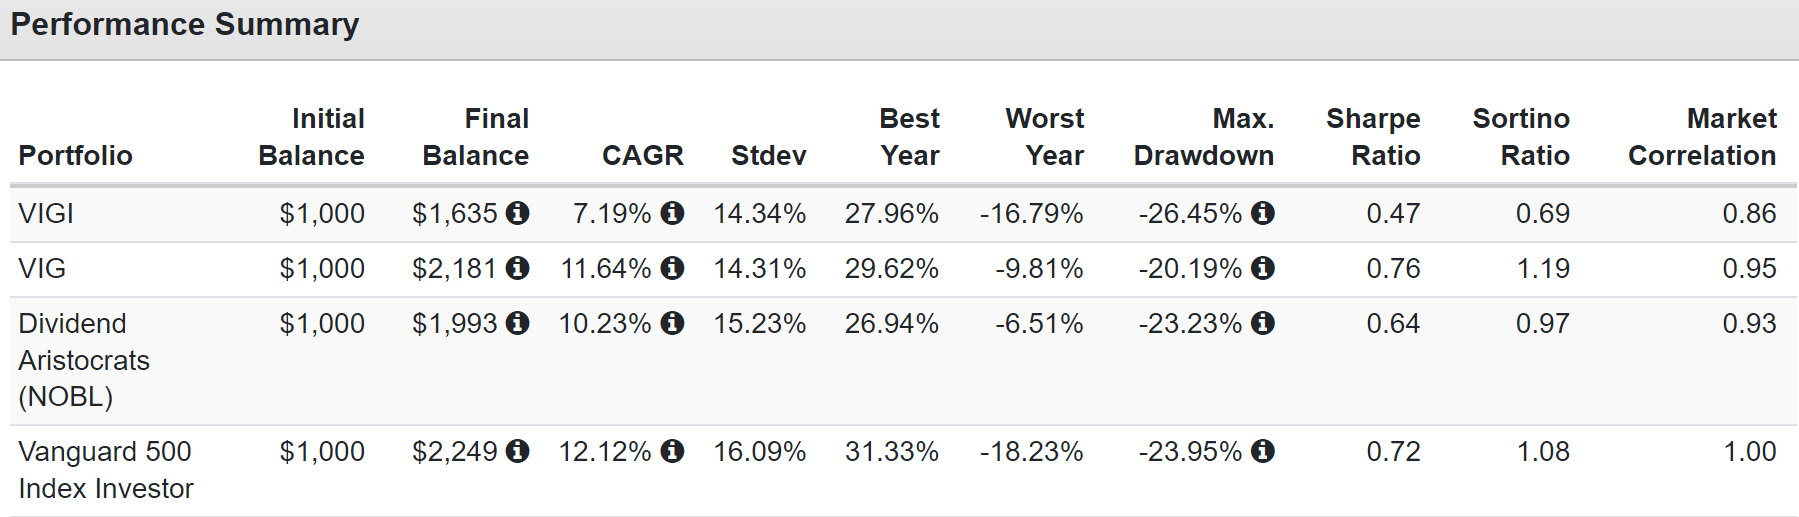
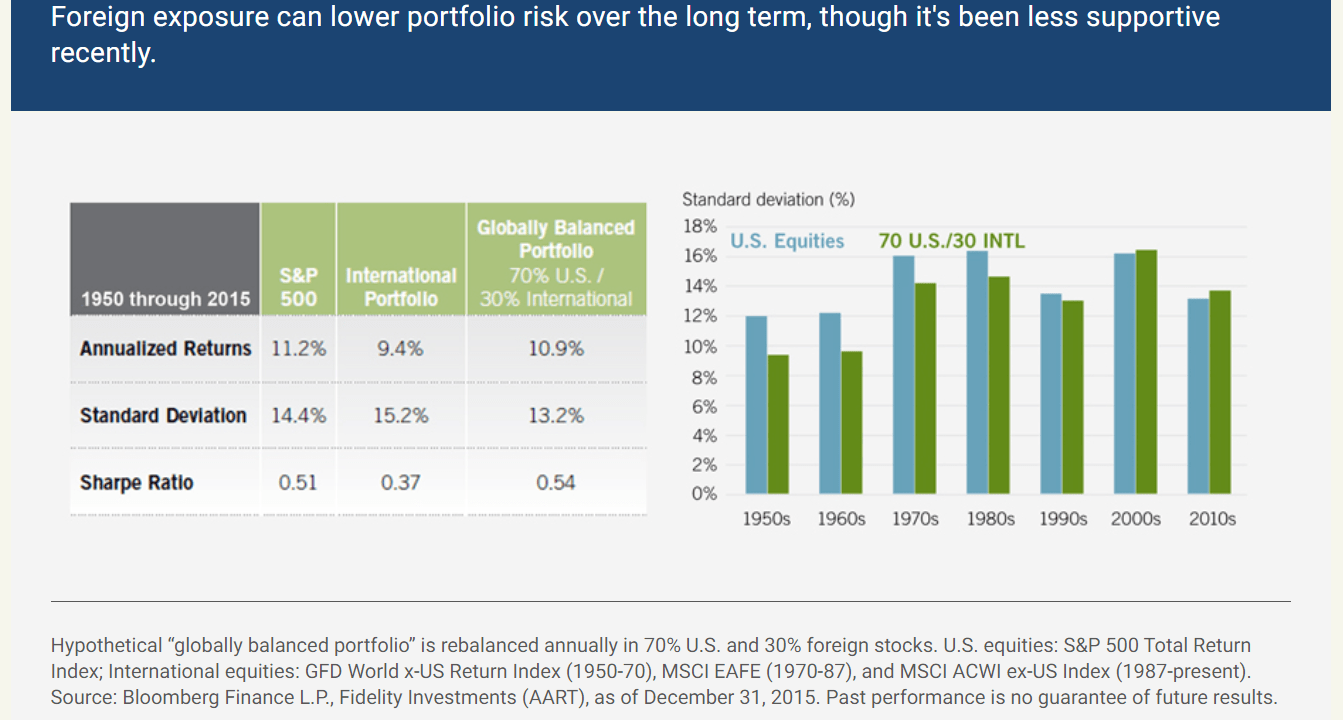
International stocks have lagged U.S. stocks for the last decade and historically.
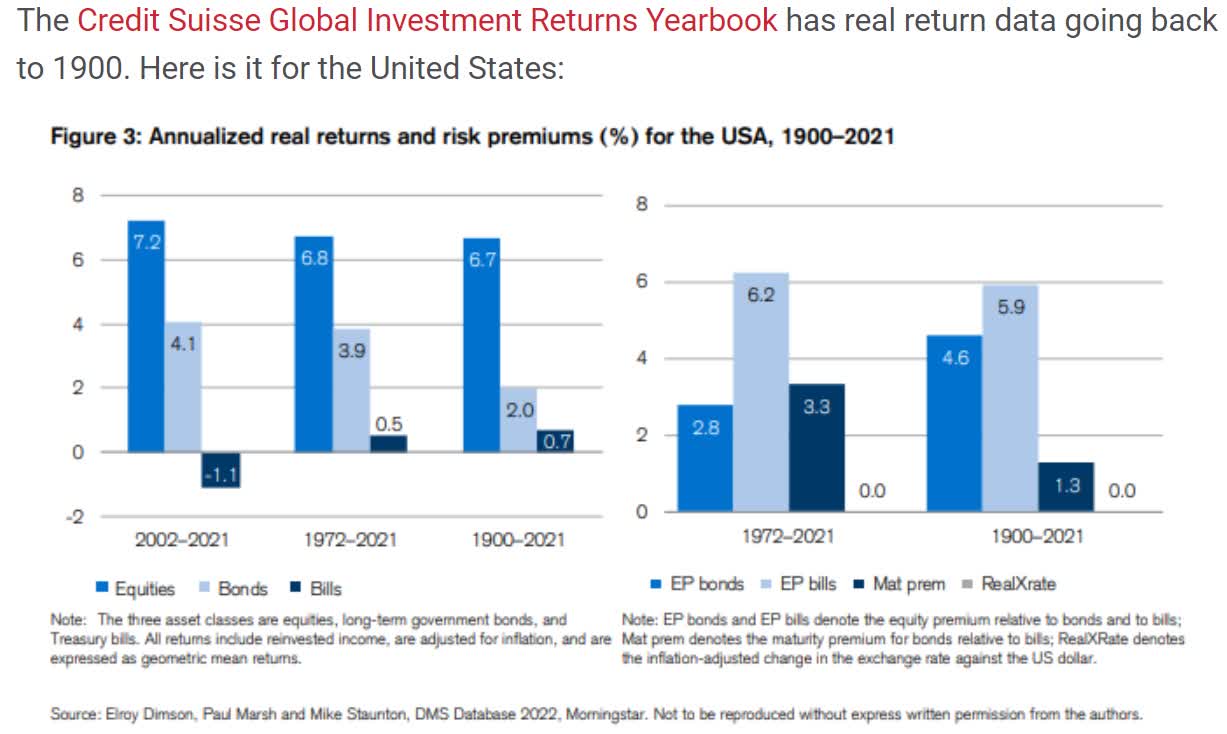
U.S. stocks have historically delivered around 7% inflation-adjusted returns for 121 years.
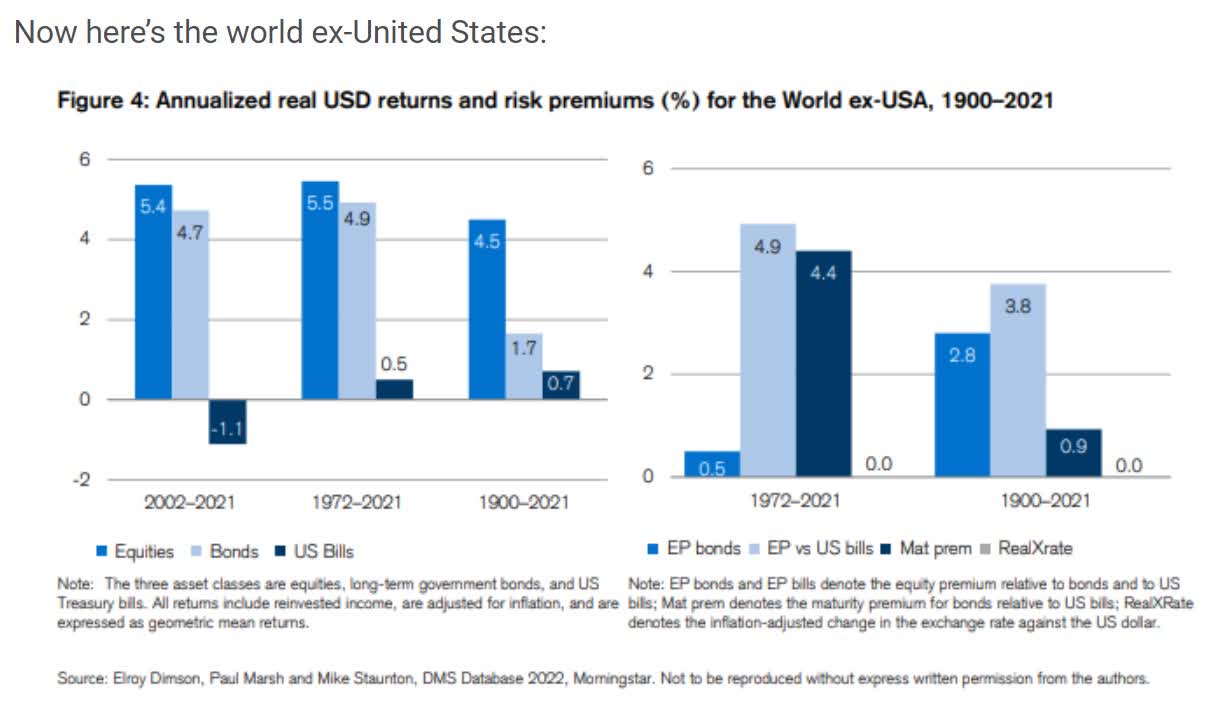
International stocks have averaged 4.5% real returns.
And it’s not just the last ten years or 120 years.
U.S. companies are better at converting every unit of GDP growth into more EPS growth than pretty much any other group of companies. Just take a look at how China, despite tripling incredible GDP growth of 2400% since 1995, has been a subpar investment.
China’s GDP growth since 1995: 2400% (12% annually).
China’s stock returns since 1995: 372% (5.7%) and 3.8% after inflation.
U.S. GDP growth since 1995: 233% (4.4% annually).
U.S. stock returns since 1995: 1430% (10.3% annually) and 7.8% after inflation.
China had 6X the economic growth of the U.S., and yet investors made almost 4X less money.
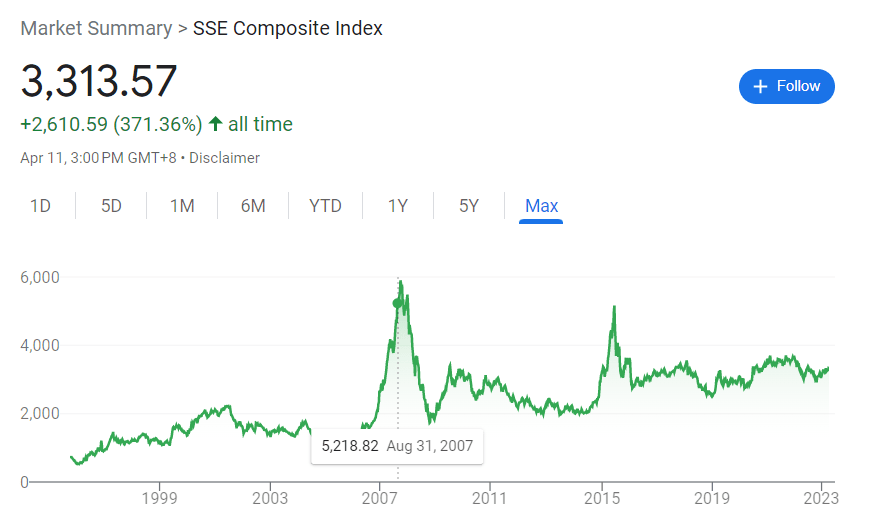
And since the 2007 peak in China’s stock market? Its GDP has tripled, yet investors have lost 43% over 16 years.
- 71% loss after inflation despite 3X GDP growth.
Bank of America estimates that for every 1% of GDP growth, U.S. companies generate 4% to 5% EPS growth.
- many emerging markets have negative or low EPS growth even with strong GDP growth
- due to poor governance
- management pays itself fat salaries and runs the companies inefficiently
- a problem in many countries, including South Korea, China, and India.
Buy World-Beater Companies, Not International For Its Own Sake
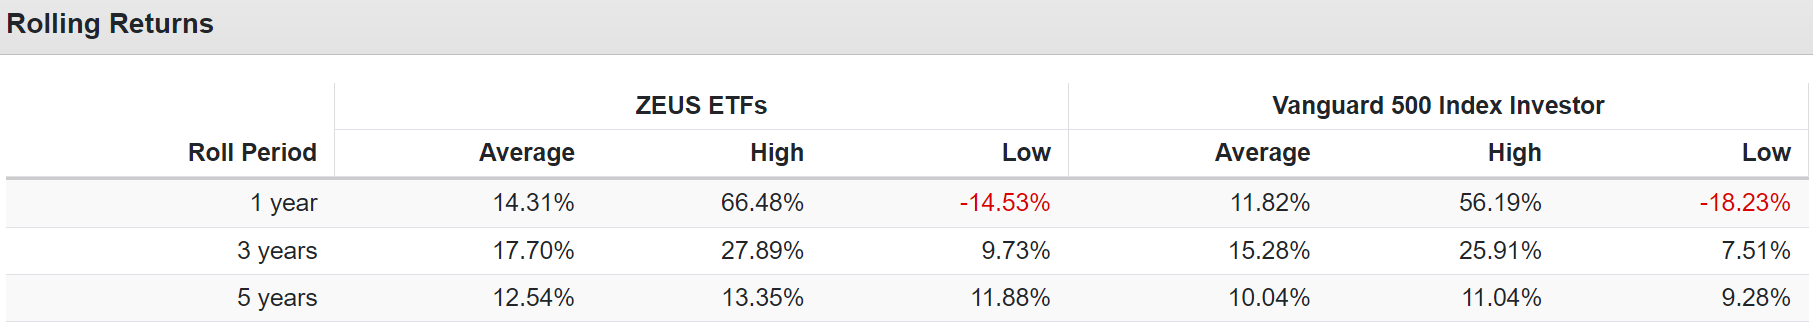
12-month rolling returns can better show how a portfolio can perform over time, smoothing out for bear markets.
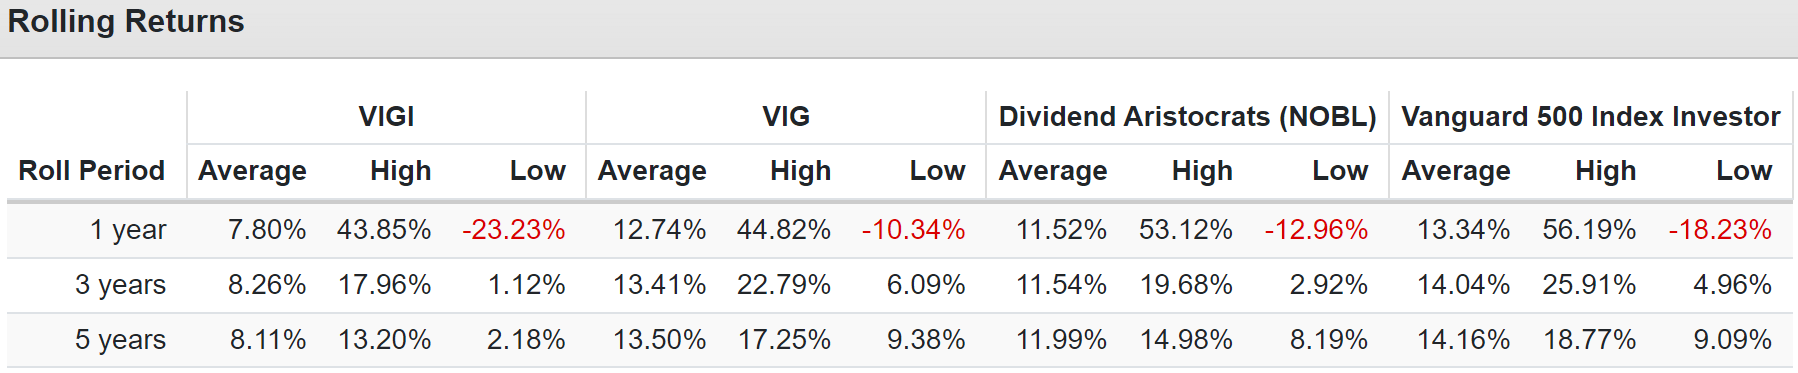
VIG’s consensus long-term return potential is 13%, which it’s delivered since 2016.
VIGI’s 11% long-term consensus is far below what it’s delivered over its 7-year existence.
NOBL’s 10% to 11% return consensus is similar to what it’s delivered historically.
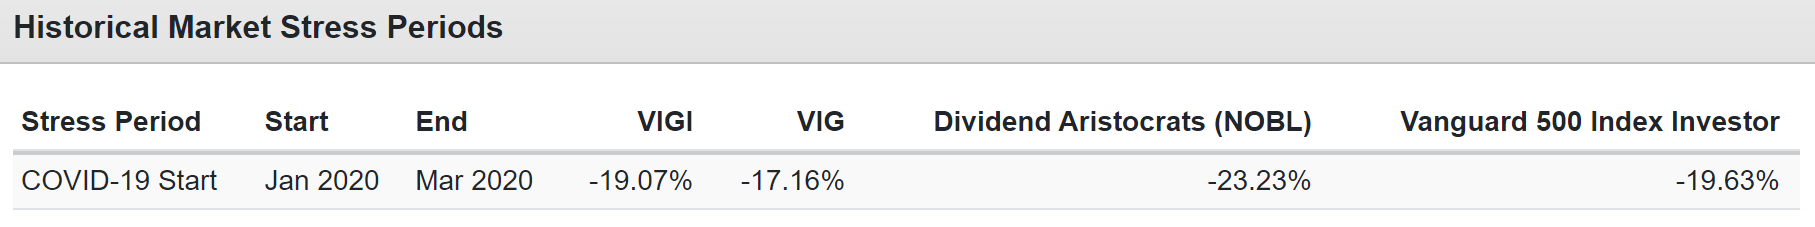
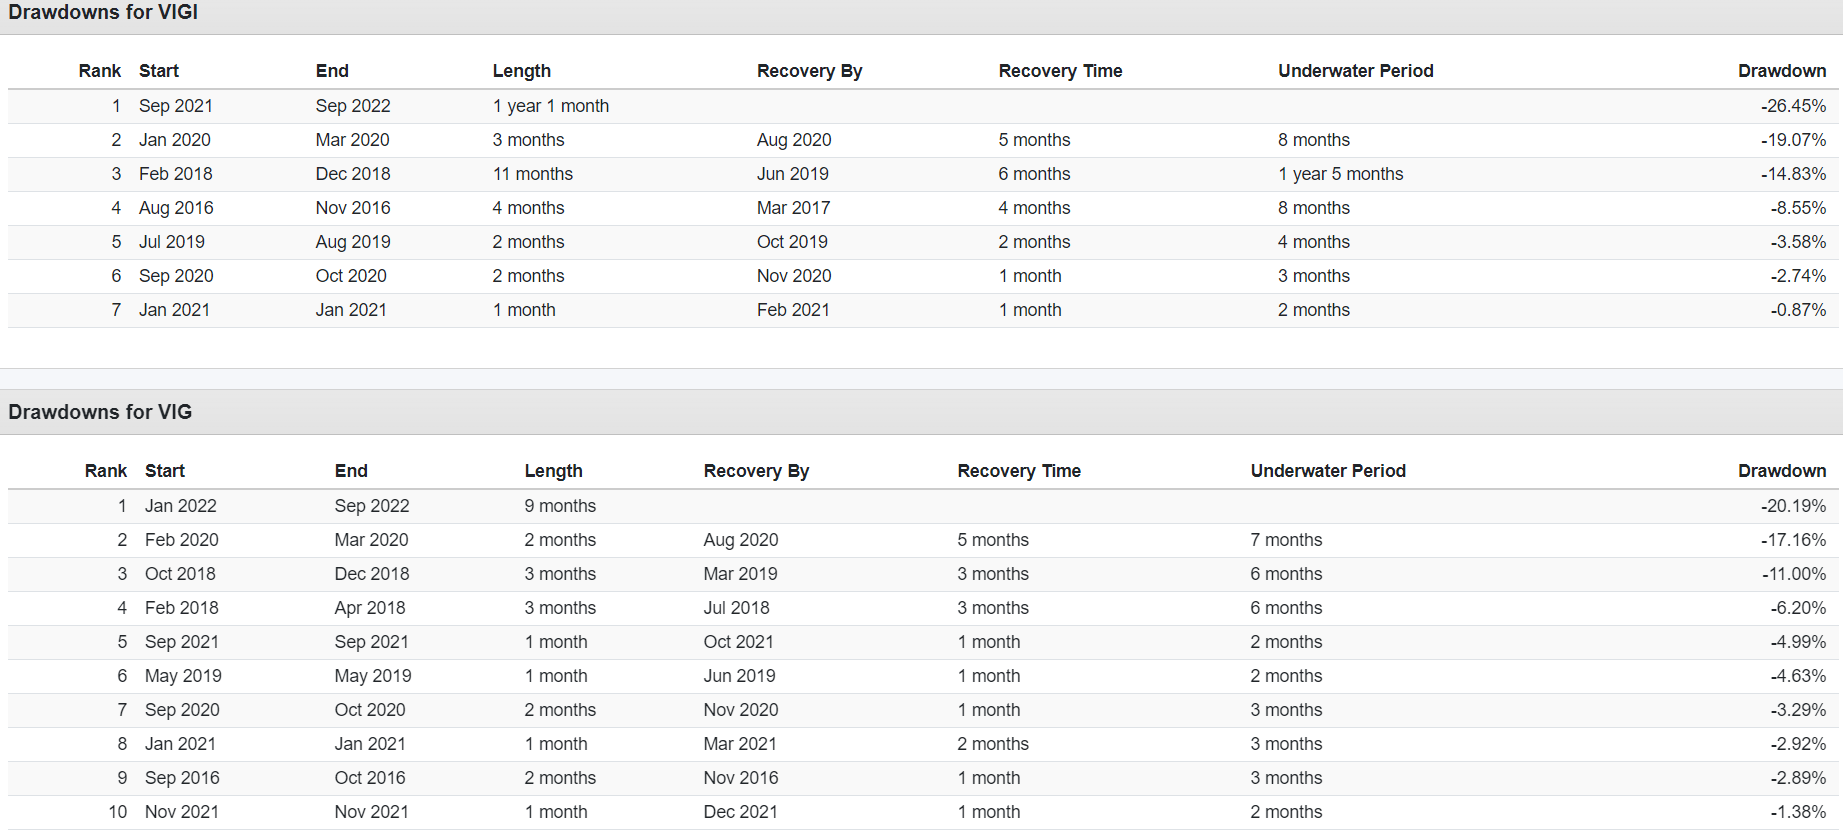
VIGI has the same annual volatility as VIG, but higher peak declines and worse returns during the Pandemic.
2022 returns
- NOBL -7%
- VIG -10%
- VIGI -17%
- S&P -18%.
During the stagflationary bear market of last year, VIG ran circles around VIGI, just as it has historically in nearly all market and economic conditions.
Bottom Line: VIGI Is A Good International Choice, But VIG Remains The King Of Aristocrat ETFs, And SCHY Is The Better International Dividend ETF
Let me be clear: I’m NOT calling the bottom in VIGI or VIG (I’m not a market-timer).
Even Ultra SWANs can fall hard and fast in a bear market.
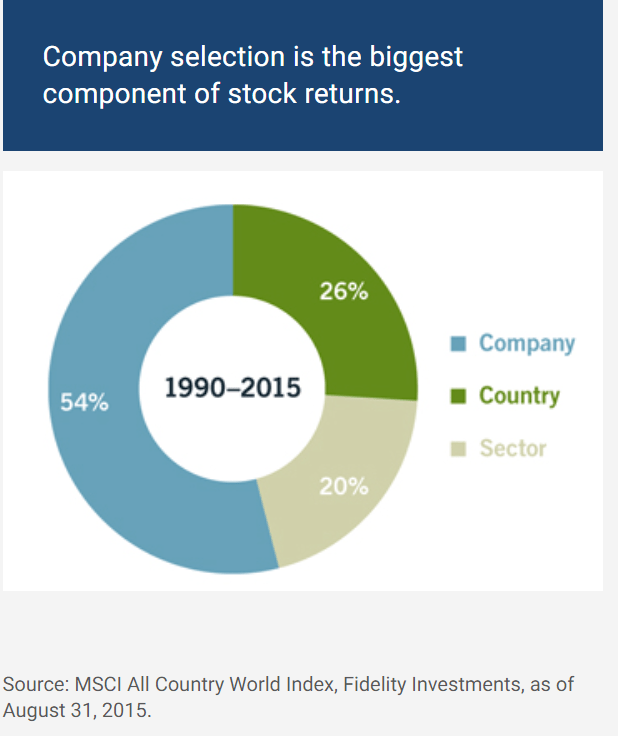
Fundamentals are all that determine safety and quality, and my recommendations.
- over 30+ years, 97% of stock returns are a function of pure fundamentals, not luck
- in the short term; luck is 25X as powerful as fundamentals
- in the long term, fundamentals are 33X as powerful as luck.
While I can’t predict the market in the short term, here’s what I can tell you about VIG and VIGI.
VIGI has some of the highest quality international dividend growth companies, with excellent free cash flow yields and very low payout ratios.
The financial health of these companies is impeccable.
However, VIG remains the gold standard of dividend growth ETFs with the following:
- superior profitability
- some of the widest moat companies on earth
- perfect dividend dependability (no annual dividend cuts in 17 years)
- superior growth potential
- similar valuation
- identical yield
- superior historical returns
- the same low volatility
- smaller peak declines.
With Schwab’s International Dividend Equity ETF offering similar return potential as VIGI and twice the yield, I consider that to be a superior choice for anyone looking for an international ETF.
However, I wouldn’t focus too much on what country the company is headquartered in but rather focus on strong fundamentals.
- Add global world-beaters like BTI and BAM to your stock bucket.
If you want to own international stocks, I continue to recommend owning individual names like BTI, TD (
History shows that U.S. stocks are a cut above when it comes to generating strong EPS and dividend growth, which is why there are so many U.S. stock ETFs I can recommend but no international ones save for SCHY (and that has yet to prove itself long term).