

Summary
- If you go by the height of the number of unfavorable dividend changes, we find the Coronavirus Recession ranks second to the Great Depression.
- Historically, unfavorable changes that reach higher than 100 per month point to periods characterized by severe levels of economic distress.
- Standard & Poor’s reported 100 unfavorable dividend changes in February 2023.
Unfavorable changes. Just saying that phrase doesn’t sound good, because it means something has turned for the worse.
When it comes to stock market dividends, it is, unfortunately, a very well established phrase. We suspect it was first deployed for that purpose on 5 October 1927 by Bertie Forbes, the founder of the long-running business magazine that still bears his name, though his surviving family members no longer own a majority stake in the company he established. At the time, he was reporting on the Roaring 1920s stock market in his syndicated column, which he quantified by counting up the dividend changes being announced each month by the firms whose stocks he tracked. With the booming stock market of that era, he was mainly reporting on favorable changes.
But in this column, Forbes used the term “unfavorable” for the first time to describe the combined total of dividend reductions and omissions that had occurred, noting there had been 21 such announcements in September 1927, and 131 overall in the year to date. In another two years, Forbes would come to use that phrase much more often as the Great Depression got underway and the number of unfavorable dividend changes exploded. His terminology took hold among the financial analysts of the day and has survived to the present.
We’ve previously presented what dividend reductions, or reductions, looked like through the Great Depression. But that only tells less than half of the story of how bad things were during that time. To tell the whole story, we need to add omitted (or passed) dividend announcements to the monthly totals of dividend reductions.
That’s what we’re doing today. But not just for the Great Depression, where we have previously compiled monthly data from January 1929 through December 1936 originally provided by the Standard Statistics Company, one of the precursor firms for today’s Standard & Poor’s. We also have S&P’s data for unfavorable dividends that runs from January 1955 through February 2023. The following chart shows all the historical data for unfavorable dividend changes we’ve been able to obtain at this point in time.
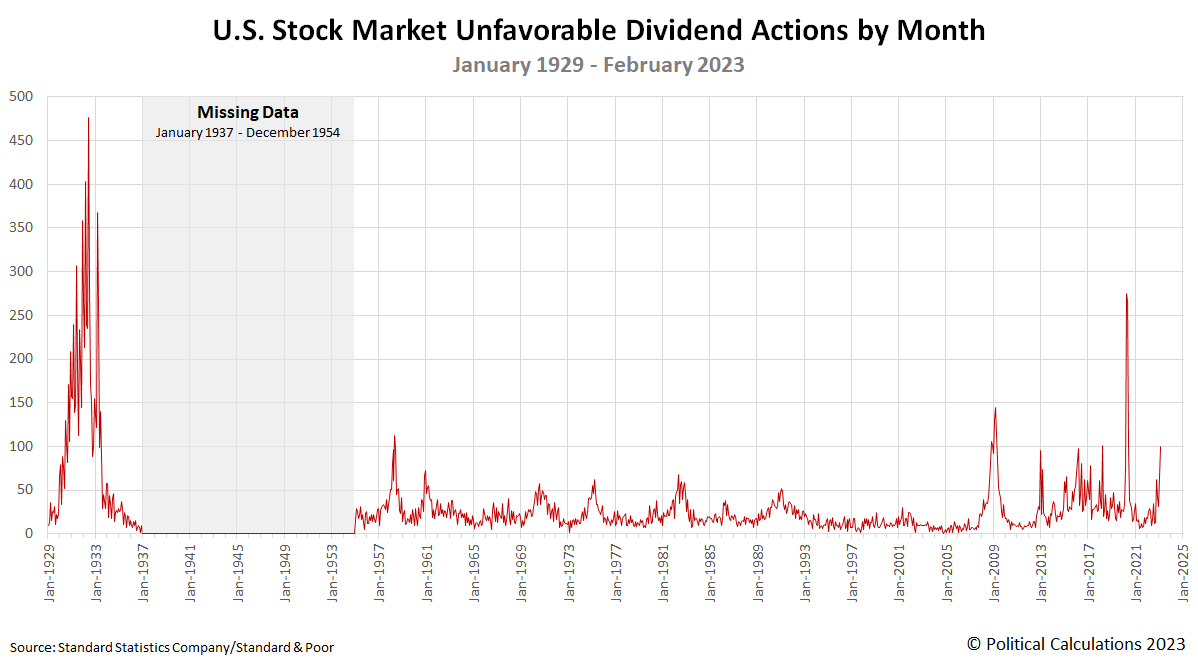
Aside from the missing data in the period from January 1937 through December 1954, the data we do have does an amazing job communicating the scale of how bad the United States’ worst economic crises were.
If you go by the height of the number of unfavorable dividend changes, we find the Coronavirus Recession ranks second to the Great Depression. The sheer mass and duration of the Great Depression’s dividend reductions and omissions clearly mark that event as far, far worse. If not for the Coronavirus Recession spike, the so-called “Great Recession” of 2008-2009 would rank second and, if we compare the areas under the numbers of unfavorable dividend changes each month, it does.
We also see some potentially useful thresholds. For the periods where we have data, having the number of unfavorable dividend changes reach a level of 50 or higher in a single month often coincides with official periods of recession or significant distress for U.S. businesses. Historically, unfavorable changes that reach higher than 100 per month point to periods characterized by severe levels of economic distress.
Standard & Poor’s reported 100 unfavorable dividend changes in February 2023.
About the Data
We previously did the legwork for compiling the Great Depression era’s unfavorable dividend changes using contemporary newspaper reports published between January 1929 and January 1937 that featured the Standard Statistics Company’s data. We thank Howard Silverblatt for providing Standard & Poor’s archived data for unfavorable dividend changes from January 1955 through December 2003. Our source for unfavorable dividend data from January 2004 through the present is Standard & Poor’s S&P Market Attributes Web File, which Howard and S&P’s analytical team compile each month.
If you compare the Standard Statistics Company/Standard & Poor’s data with that reported by B. C. Forbes in the 1920s and 1930s, the historic S&P data presents a more complete picture. It represents the dividend announcements of all publicly-traded firms in the U.S. stock market, while Forbes’ data is based on a smaller subset of U.S. firms he regularly tracked.
References
Standard & Poor’s. S&P Market Attributes Web File. [Excel Spreadsheet]. 1 March 2023.