
Summary
- What does it take to quickly reverse an improving outlook for dividends?
- Investors have quickly become far more gloomy than they had been before the bank failures and the Biden administration’s response to them.
- Dividend futures indicate the amount of dividends per share to be paid out over the period covered by each quarters dividend futures contracts.
What does it take to quickly reverse an improving outlook for dividends?
As we learned last week, it takes the second-largest bank failure in U.S. history combined with two additional bank seizures by federal regulators over a weekend. On top of that is a Federal Reserve that’s set on fighting inflation by hiking interest rates again, never minding that their previous rate hikes directly contributed to the insolvency issues that caused the second-largest bank failure in U.S. history.
How did all that affect the outlook for the dividends of the S&P 500 (Index: SPX
Political Calculations is uniquely positioned to demonstrate how negative because we can build off the animated chart we recently featured that illustrated how much the outlook for dividends had improved since the end of 2022 through mid-February 2023. Our new animated chart cycles through the days from 15 February 2023 through 17 March 2023. As you’ll see, there’s not much negative movement until we get past the halfway point, with the most evaporation happening during the final week of the animation.
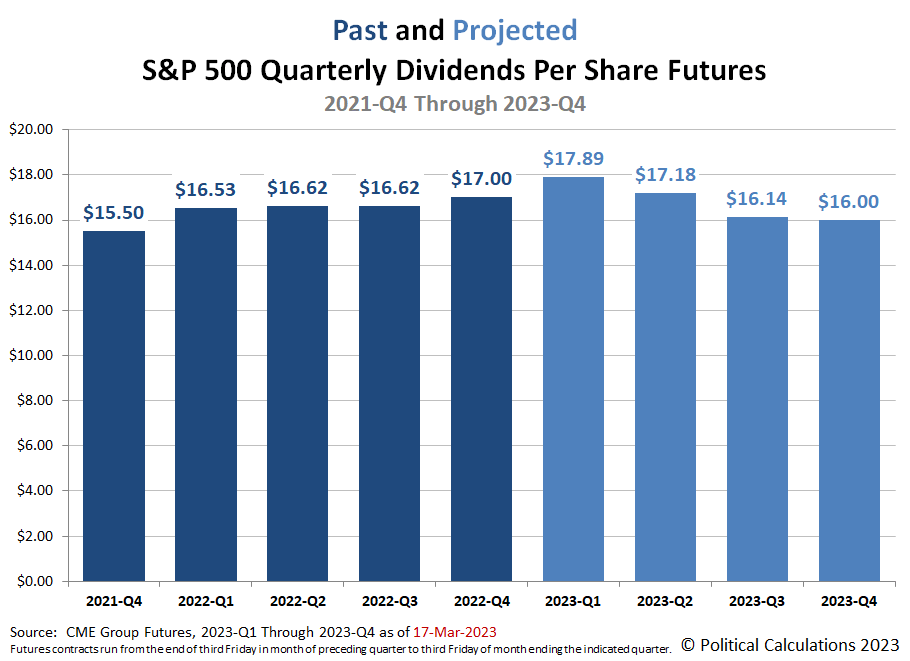
The chart shows the expected dividends for the upcoming third and fourth quarters of 2023 have dropped below the levels recorded for the same quarters in 2022. Investors have quickly become far more gloomy than they had been before the bank failures and the Biden administration’s response to them.
That’s also gloomier than what they expected at the end of 2022, as the rapid negative change in expectations for future dividends during these quarters has more than offset the improvement they recorded earlier in 2023.
More About Dividend Futures Data
The dividend futures data we visualized in the animated chart is based on our records of the S&P 500’s Quarterly Dividend Index Futures reported by the CME Group going into each trading day from 15 February through 17 March 2023.
Dividend futures indicate the amount of dividends per share to be paid out over the period covered by each quarters dividend futures contracts, which start on the day after the preceding quarter’s dividend futures contracts expire and end on the third Friday of the month ending the indicated quarter. So for example, as determined by dividend futures contracts, the quarter of 2023-Q1 began on Saturday, 17 December 2022 and ended on Friday, 17 March 2023.
That makes these figures different from the quarterly dividends per share figures reported by Standard & Poor’s. S&P reports the amount of dividends per share paid out during regular calendar quarters after the end of each quarter. This term mismatch accounts for the differences in dividends reported by both sources, with the biggest differences between the two typically seen in the first and fourth quarters of each year.
Because we’re not mixing S&P’s data with the CME Group’s dividend futures data, the animated chart is providing an apples-to-apples comparison for the different snapshots in time of investor expectations.