

Now that the Federal Reserve appears to have abandoned its forward guidance tool in favor of being “data dependent” to help inform its future path for rates, investors should keep an eye on this gauge of inflation expectations for signs of a shift in the market’s mood.
Watch the five-year break-even inflation rate, one of the most reliable indicators of inflation expectations, to help gauge the direction of the Fed’s monetary policy, a team of macro strategists from Jefferies Group JEF, 0.34% said.
The five-year break-even rate has helped to foretell the direction of stocks all year, and it could very well offer clues as to where stocks might be headed next, the team said.
The five-year break-even rate represents the difference in yields between the five-year nominal Treasury note TMUBMUSD05Y, 2.673%, and the five-year Treasury inflation-protected securities note 9128286N55, -0.166%. Bond yields rise as prices fall.
According to the Federal Reserve Bank of St. Louis, this spread represents the premium demanded by holders of inflation-protected securities, which makes it an effective proxy for the market’s expectation of the average rate of inflation over the coming five years.
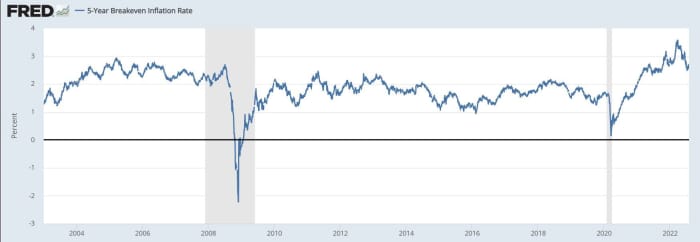
After rising sharply in the year’s first half as inflation expectations soared and U.S. stocks plunged, the five-year break-even rate pulled back sharply in late June and early July, eventually hitting its lowest level of 2022 on July 6, when it broke below 2.5%, according to St. Louis Fed data.
This recent drop, which coincided with falling commodity prices and Treasury yields, appears to have preceded the latest leg higher in stocks. In July, the S&P 500 SPX, -0.18%, Dow Jones Industrial Average DJIA, 0.01% and Nasdaq Composite COMP, -0.04% each cemented their best month in roughly two years, with the Nasdaq surging more than 12%.
David Zervos, chief market strategist at Jefferies, said he expects the rally in stocks to continue in the coming days and weeks, but that he will be closely watching the five-year break-even rate and economic data, in a Sunday note to clients.
“…[W]e expect [Fed Chairman] Jay [Powell] will be very carefully watching how inflation expectations respond to this substantive change in the overall stance of policy/guidance. So if inflation breakevens or the inflation expectation surveys data start to jump, we will quickly see a change in Jay’s tone,” Zervos noted.
Gauging a Fed pivot
The recent pullback in inflation expectations has prompted Fed funds futures traders to anticipate that the policy rate will peak at 3.50% later this year, followed by rate cuts as early as next spring, according to the CME’s FedWatch tool.
In response, economists from Deutsche Bank and analysts at Goldman Sachs have questioned whether investors have become too optimistic about potential rate cuts next year. So far, however, U.S. stocks appear to have shrugged off those concerns.
Looking ahead, investors likely would need to see a substantial shift in inflation expectations, or serious deterioration in the strength of the labor market and underlying economy, to spark another round of sharp selling in stocks, the Jefferies team wrote.
Because of this, the five-year break-even rate will be “the key metric to watch to confirm the pivot” for both the Fed, and for stocks, Zervos said.
Fed still wants 2% inflation
Fed Chairman Powell has repeatedly highlighted the importance of inflation expectations in postmeeting press briefings. On Wednesday, he reiterated that the Fed aims “to bring inflation back down to our 2 percent goal and to keep longer-term inflation expectations well anchored.”
U.S. inflation remained at a 40-year high through the end of June, according to the latest reading from the personal-consumption price index, which was released days after last week’s Fed rate hike. A day later, second-quarter gross domestic product data confirmed that the U.S. economy contracted again in the second quarter, sparking more debate about if the American economy already has tipped into a recession.
Market-based indicators have been especially helpful at a time when the Fed has all but abandoned forward guidance, leaving investors to parse conflicting messages from Powell and other Fed insiders.
Many equities strategists have cheered the prospect of a Fed pivot, or a move away from aggressively raising rates, later this year. But Minneapolis Fed President Neel Kashkari in recent days told the New York Times and CBS News that the Fed remains “a long way away” from backing off its inflation fight.
On Monday, Bloomberg News published an editorial penned by former New York Fed President Bill Dudley, who slammed investors’ “wishful thinking” about a Fed pivot as “both unfounded and counterproductive.”
From a purely technical standpoint, some market technicians expect stocks to be poised for more upside, after they retraced nearly half of their year-to-date losses.
For the S&P 500, the next key resistance level would be 4,178, according to John Kosar, chief market technician at Asbury Research. Should the U.S. benchmark trade above that level for at least several sessions, the next key resistance level would be between 4,279 to 4,346. The next key “support” level for the S&P 500, should it pull back, would be between 3,922 and 3,946.
U.S. stocks lost a grip on modest gains Monday afternoon. The benchmark fell 0.4% to about 4,105, while the Nasdaq Composite was down 0.5% near 12,316 in afternoon trade. The Dow Jones Industrial Average was off 0.4% near 32,698.