
Investors keyed in on U.S. Treasury and dividend ETFs as markets rebounded in July.
Mentioned: Tesla Inc (TSLA), iShares Core S&P 500 ETF (IVV), iShares Core S&P Small-Cap ETF (IJR), iShares 20+ Year Treasury Bond ETF (TLT), Amazon.com Inc (AMZN), Chevron Corp (CVX), Advanced Micro Devices Inc (AMD), Citigroup Inc (C), Wells Fargo & Co (WFC)
July brought relief after stock and bond markets endured a difficult first half of the year. The Morningstar Global Markets Index, a broad benchmark of global equities, advanced 7.03%, its best month since November 2020. While the same economic factors that wreaked havoc in the first half of the year continued to cast uncertainty on the future, better-than-expected corporate earnings drove most stocks ahead. Bonds also rallied. The Morningstar US Core Bond Index climbed 2.41% in its best month since August 2019.
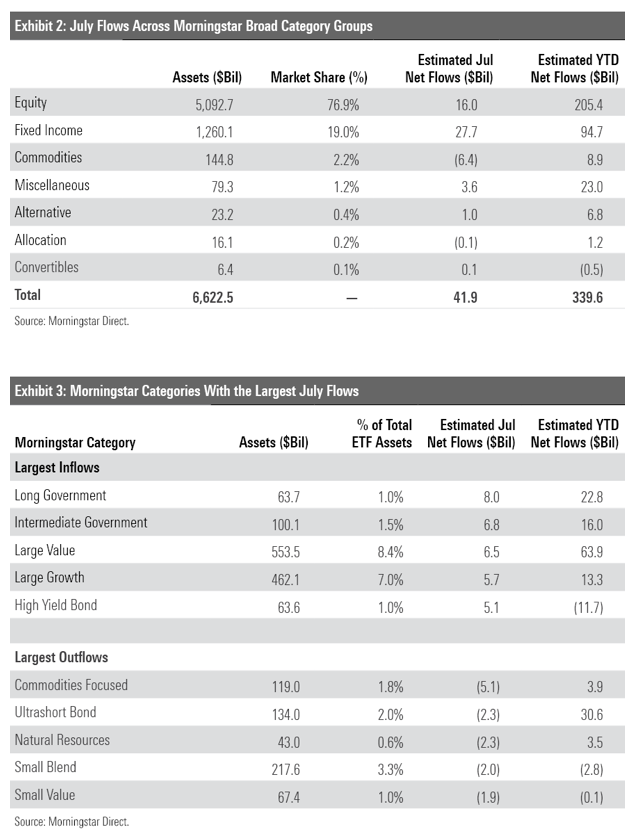
The turnaround in performance did not spark enormous flows. Investors plowed $41.8 billion into U.S. exchange-traded funds in July, a smaller amount than the $48.7 billion average over the first six months of the year. Fixed-income funds’ $27.7 billion inflow led the way in July, while stock ETFs hauled in a modest $16 billion. All told, ETFs have absorbed $339.6 billion for the year to date through July.
Here, we’ll take a closer look at how the major asset classes performed last month, where investors put their money, and which corners of the market look rich and undervalued at month’s end—all through the lens of ETFs.
Exhibit 1 shows July returns for a sample of Morningstar Analyst-rated ETFs that serve as proxies for major asset classes. A blended global portfolio clawed back nearly all of its June losses with a 5.37% gain in July. The portfolio’s bond sleeve came back to life. After Vanguard Total Bond Market ETF (BND) and Vanguard Total International Bond ETF (BNDX) shed over 10% apiece in the first half of 2022, the two bond sleeve components advanced 2.34% and 3.37%, respectively, in July. Global bond markets took various central banks’ interest-rate hikes in stride, even those in the eurozone that were more aggressive than many anticipated.
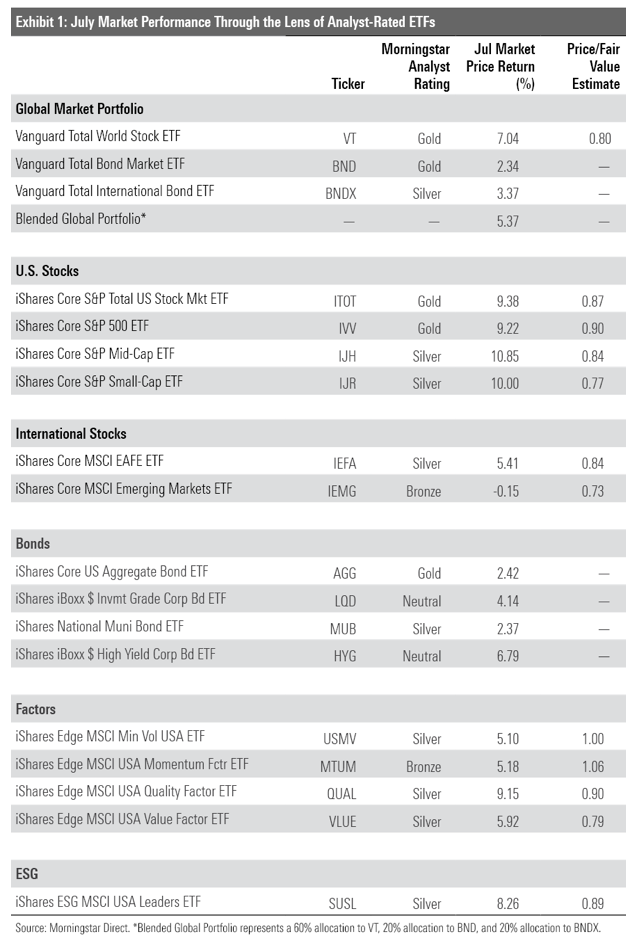
While both bond ETFs pushed the blended portfolio in a positive direction, the stock sleeve was responsible for most of its gains. Vanguard Total World Stock ETF (VT) leapt 7.04% in July for its best month since November 2020. International stocks, which constituted about 41% of VT at the end of June, trailed a bit behind that number. Vanguard Total International Stock ETF (VXUS) added 3.64% last month. Developed-markets stocks held their own, but their emerging-market peers didn’t see the same rebound. IShares Core MSCI Emerging Markets ETF (IEMG) slid 0.15%, as Chinese firms— which shape about one third of the portfolio—went in reverse after a resilient second quarter. The Morningstar China Index shed 9% in July, which ranked second to last among all Morningstar country-specific indexes in July.
U.S. stocks launched a more powerful July rebound. IShares Core S&P U.S. Total Stock Market ETF (ITOT) shot up 9.38% after tumbling 21.31% in the year’s first half. July’s corporate earnings reports revealed that companies’ ability to weather economic obstacles like persistent inflation, labor shortages, and shifting consumer spending patterns exceeded analysts’ meager expectations. Of the 56% of S&P 500 companies to report earnings through the end of July, 73% delivered earnings per share ahead of consensus estimates, per FactSet. The corporate earnings reported thus far were fairly weak in absolute terms, and the economic headwinds in place are unlikely to shift anytime soon. Still, July offered a reprieve for many stock investors and indicated that the market’s first-half fears could have been baked into prices with a heavy hand.
In another trend reversal from the first half, growth stocks came out ahead of their value peers in July. Vanguard Growth ETF’s (VUG) 13.04% return—its best since April 2020—exceeded counterpart Vanguard Value ETF’s (VTV) by about 8 percentage points. Some of the market’s heaviest hitters returned to form, swinging VUG in the right direction. Amazon.com (AMZN) and Tesla (TSLA) offered sunny outlooks that precipitated July returns of 27.06% and 32.38%, respectively. Semiconductor stocks, which constituted about 6.5% of VUG entering July, bounced back from dreadful starts to the year as well. Top-10 holding Nvidia (NVDA) notched a 19.82% July return, and Advanced Micro Devices (AMD) rose 23.54%. That said, much work remains before these firms return to their late-2021 peaks.
Cheaper stocks trailed their richly valued peers in July but didn’t miss out on all the fun. VTV advanced 5.06%, as oil stocks, the standouts of 2022 thus far, continued to roll even as oil prices retreated from their June apexes. Behemoths like Exxon Mobil (XOM) and Chevron (CVX) reported excellent results that powered July returns of about 13% each. The former reported second-quarter earnings that nearly quadrupled their 2021 mark. A few banks lifted VTV as well, as firms like Wells Fargo (WFC) and Citigroup (C) run lending operations that should become more profitable when interest rates rise.
Performance was mostly even within iShares’ suite of single-factor strategic-beta funds. IShares MSCI USA Quality Factor ETF’s (QUAL) growth tilt propelled a 9.15% July return—its best since November 2020—but funds focused on volatility, momentum, and value only added between 5% and 6% apiece. IShares MSCI USA Minimum Volatility Factor ETF (USMV) should be expected to trail the broad market in months like July; it’s constructed to hold up better in down months but trail during rallies. Indeed, it beat the Morningstar US Market Index by 5.72 percentage points for the year through July.
The pain continues for iShares MSCI USA Momentum Factor ETF (MTUM). At its May rebalance, the fund cut its tech and consumer discretionary exposure from a combined 41% of the portfolio to 11%, turning instead to more-defensive stocks in the consumer staples, healthcare, and utilities sectors. That new complexion worked against it in July, as tech and consumer discretionary stocks led all sectors. It’s difficult to capture momentum without shifting sector allocation, but unfavorable timing has left the fund with a 20.8% year-to-date decline that trailed the Morningstar US Market Index by 6.9 percentage points.
Investors piled $41.9 billion into ETFs in July. Stock ETFs collected a tepid $16 billion, their second-lowest sum since the start of 2021. Bond ETFs, on the other hand, snapped back from a quiet June to the tune of a $27.7 billion inflow, their second-loftiest mark of the calendar year.
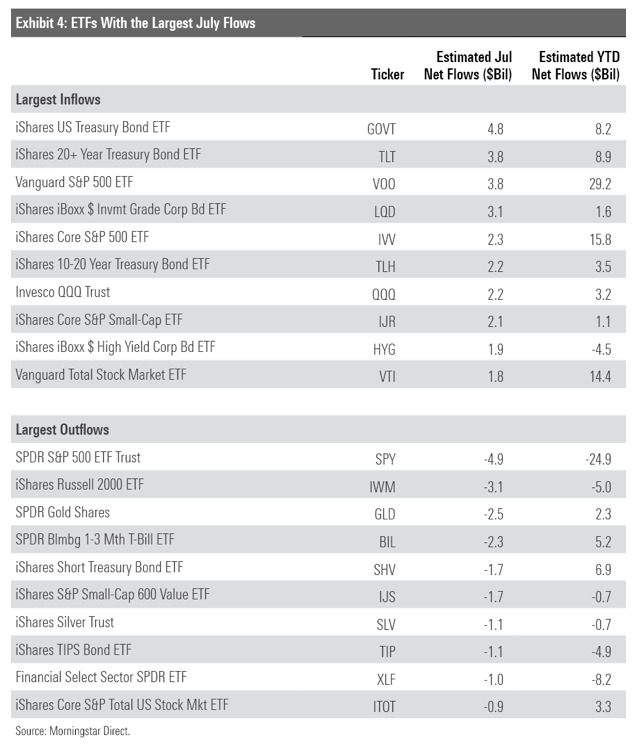
Markets steadied in July, but investors flocked to the safety of bond funds backed by the faith of the U.S. government. The long and intermediate government Morningstar Categories hauled in $8 billion and $6.8 billion, respectively, in July. Neither of these categories rank among the top 15 in total assets under management. A pair of Treasury funds led the way: iShares U.S. Treasury Bond ETF (GOVT) ($4.8 billion inflow) and iShares 20+ Year Treasury Bond ETF (TLT) ($3.8 billion). Each of these funds has collected more than $8 billion for the year to date. Investors did not show the same appetite for shorter-dated Treasury portfolios; the short government category pulled in a milder $1 billion in July. After yields climbed in the first half of the year, many bond investors opted to lock them in for the long term.
Investors’ appetite for interest-rate risk has changed since late 2021, when inflation concerns directed most bond ETF flows. For example, inflation-protected bond and bank-loan funds, both of which tend to offer better inflation shelter than conventional fixed-income portfolios, saw lucrative inflows last year. Each endured July outflows, however, and have now surrendered between $1 billion and $1.5 billion so far this year. Even ultrashort bond funds, whose short maturities invite very little interest-rate risk, suffered outflows in July after they absorbed $33.6 billion in the first half of the year.
Commodity fund flows best illustrate investors’ newfound confidence that inflation will soon recede. Portfolios that focus on commodities like precious metals and natural resources weathered inflation well, and their lucrative start to this year reflected that. But after focused commodities funds raked in $12.7 billion in the first quarter, they proceeded to bleed $4.2 billion in the second quarter and another $5.1 billion in July, the worst outflows among all categories. ETFs that target broad baskets of commodities followed the same trajectory, losing $1.2 billion last month. Between the recent distaste for commodities and sudden comfort with interest-rate risk, it appears investors’ inflation concerns have abated.
While Treasury funds ruled the roost in July, investors did not take credit risk off the table. The high-yield bond category, which houses below-investment-grade bond portfolios, reeled in $4.6 billion in July. That marked back-to-back months of inflows for the first time since spring 2021. IShares iBoxx $ High Yield Corporate Bond ETF (HYG) and SPDR Bloomberg High Yield ETF (JNK) pulled in $1.9 billion and $1.7 billion, respectively, to lead the way. That said, the high-yield category has much work to do before it breaches positive flows territory for the year. These funds have collectively leaked $11.7 billion in 2022, second-worst among all categories.
In the stock universe, dividend-focused funds continued to stand out. These portfolios held up far better than the broad market in the first half, and investors took note. Dividend funds added a fresh $5.8 billion in July, headlined by SPDR S&P Dividend ETF (SDY) ($1.6 billion) and SPDR Portfolio S&P 500 High Dividend ETF (SPYD) ($1.4 billion). Seven months into the year, dividend funds have pulled in $49.6 billion—24% of stock ETF net flows—despite representing only 7% of the total assets.
Volatile markets tend to hit small-cap stocks harder than their large-cap brethren, but performance has been fairly even across the market-cap ladder this year. IShares Core S&P Small-Cap ETF (IJR) trailed iShares Core S&P 500 ETF (IVV) by 66 basis points for the year through July. Comparable performance has not convinced investors that small caps are attractive. U.S. small-cap blend, value, and growth funds have collectively leaked $2.5 billion in 2022, while their large-cap peers have hauled in $133.3 billion.
The world’s largest ETF provider added $17.3 billion to its war chest in July. IShares’ fixed-income funds collectively hauled in $19.6 billion, while its more robust equity ETF lineup endured $406 million of outflows.
In that sense, July was a microcosm of 2022 for iShares. Bond ETFs represent only 24% of its total AUM but have accounted for 57% of their net flows. U.S. Treasury funds like GOVT and TLT, the two overall flows leaders in July, have set the pace. Vanguard still leads iShares in the 2022 ETF flows race, but its margin would be much wider without the stellar inflows into the iShares’ fixed-income lineup.
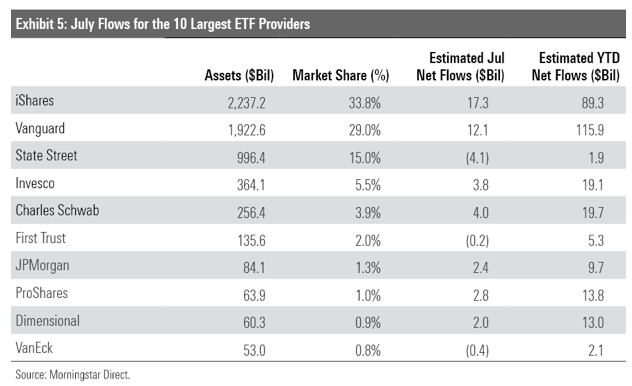
Charles Schwab raked in $4 billion in July, the 25th consecutive month its ETFs finished with positive net flows. Schwab has found success in simplicity. Its ETF lineup comprises only 27 funds, fewer than any other top-10 ETF provider except Dimensional (24). Most of its index funds are cheap and well-constructed, like Schwab U.S. Dividend Equity ETF (SCHD), which has a Morningstar Analyst Rating of Silver. After that fund pulled in $986 million in July, its year-to-date inflow stands at $8.1 billion. Focusing on low-cost, sensible ETFs has been a winning strategy for Schwab commercially and for investors financially, making its recently launched Schwab Crypto Thematic ETF STCE a head-scratcher.
The fair value estimate for ETFs rolls up our equity analysts’ fair value estimates for individual stocks and our quantitative fair value estimates for stocks not covered by Morningstar analysts into an aggregate fair value estimate for stock ETF portfolios. Dividing an ETF’s market price by this value yields its price/fair value ratio. This ratio can point to potential bargains and areas of the market where valuations are stretched.
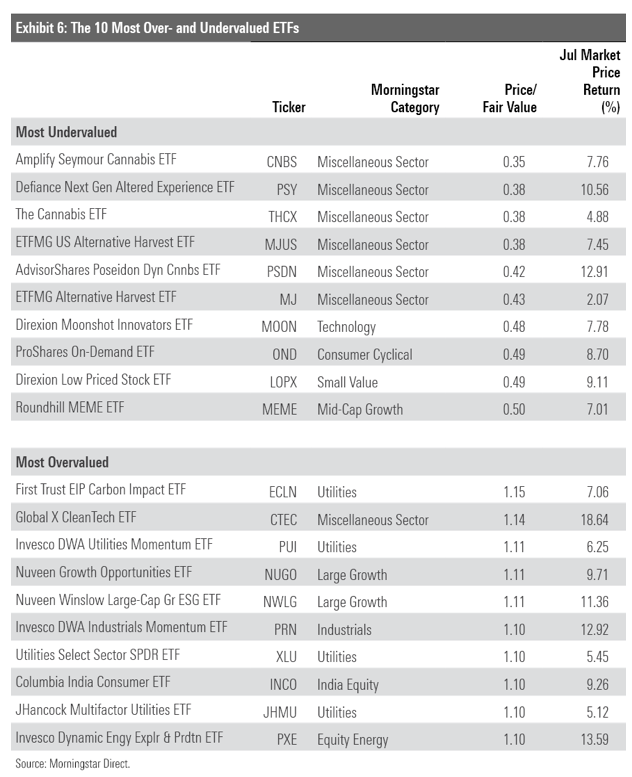

Funds that aim to leverage the legalization of cannabis or other drugs continue to dominate the cheaper half of Exhibit 6, which features ETFs that traded at the lowest prices relative to their fair value at July’s end. Each cannabis fund on the list with a one-year track record has shed at least two thirds of its value over the past 12 months. July offered a glimmer of hope for investors waiting for these funds to light up, however, as each cannabis ETF on the list climbed. Whether July was a dead-cat bounce or the start of a revival remains to be seen, but these funds have ample room to run.
Several funds that focus on the energy transition populate the richer half of Exhibit 6. It’s been a roller-coaster ride for these thematic offerings. ALPS Clean Energy ETF (ACES), for example, notched a 140.2% gain in 2020, only to slide 19.31% in 2021. Its descent continued this year until the surprise announcement that the U.S. Senate agreed to terms on a $369-billion climate-change bill breathed life into these funds. While their early-2021 peaks are still miles away, July marked a significant step in the right direction.
De-SPAC ETF (DSPC) headlines the cheaper half of Exhibit 7. This fund’s solid July performance does little to salvage what has been a miserable existence: It lost 64.2% of its value from its May 2021 inception through July 2022, which ranked dead last among all ETFs and open-end funds in the U.S. equity category group. The fund weaves a portfolio of 25 companies that went public via merger with a special-purpose acquisition company. The buzz around SPACs had mostly dissolved by the time this fund launched last year, serving as an important reminder: Investors that chase what’s trendy are often the ones left holding the bag.