
Which Type of Dividend Fund Do You Prefer?
They may carry the same name, but not the same investment approach.
Mentioned: Vanguard Dividend Growth Inv (VDIGX), Columbia Dividend Income Inst (GSFTX), iShares Core High Dividend ETF (HDV), Schwab US Dividend Equity ETF™ (SCHD), ALPS Emerging Sector Dividend Dogs ETF (EDOG), AAM S&P 500 High Dividend Value ETF (SPDV), SPDR® S&P Dividend ETF (SDY), Vanguard Dividend Appreciation ETF (VIG), WisdomTree US High Dividend ETF (DHS)
Last week’s column “Are Dividend Funds All That?” showed that equity funds that hold dividend-paying stocks have thrived over the long term. Usually, bear-market heroes are bull-market flops, but dividend funds have been exceptions. They not only have resisted downturns but have also profited from stock rallies. (This discussion assumes that investors are using tax-sheltered accounts. Because dividend funds are tax-unfriendly, they are ill-suited for taxable accounts.)
Thus, unlike with my usual fund discussions—which conclude that nobody needs those investments—dividend funds deserve further consideration. Their strategies reside on a spectrum. Some dividend funds seek high upfront income, while others favor companies that pay moderate but growing dividends. This article evaluates each approach, then finishes by recommending the top candidates.
One hundred twenty-seven U.S. equity funds have “dividend” in their names. Seventy-two are mutual funds, while 55 are exchange-traded funds. Here are their median results.
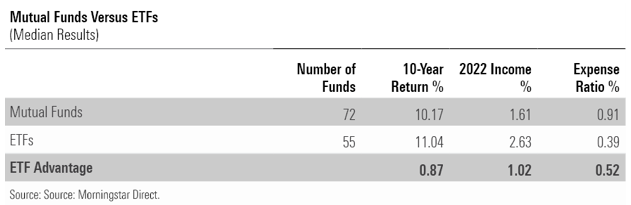
As the mutual funds are almost all actively run, and 80% of the ETFs are indexed, these totals do not reflect well on active management. Not only are ETFs cheaper, but most have outgained mutual funds by even more the cost difference, and they currently outyield them by greater than that amount as well.
Dividend funds offer a range of yields. The following chart shows the 90th, 75th, 25th, and 10th percentiles for their current income, along with the median result.
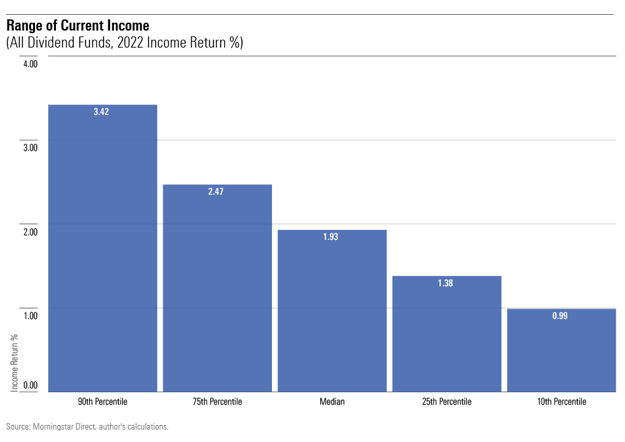
Unsurprisingly, most of the top-paying funds style themselves as “high dividend.” Examples include iShares Core High Dividend ETF HDV (
Such funds tend to have low costs. Because funds initially pay their expenses from income, dipping into their capital only if required, their outlays directly reduce yield—a painful penalty for investments that boast about their distribution rates. Consequently, most “high dividend” funds have expense ratios of less than 0.50%.
Of course, as dividend funds are far from being the highest-yielding investments—these days, even cash pays more—current income alone is insufficient. If stock prices rise, as has generally been the case in recent years, then dividend funds must increase their net asset values to justify their existence. After all, the reason investors own dividend funds rather than bonds is to boost their capital.
The following chart echoes its predecessor in depicting the various percentiles for dividend funds, but this time it shows capital growth rather than current income.
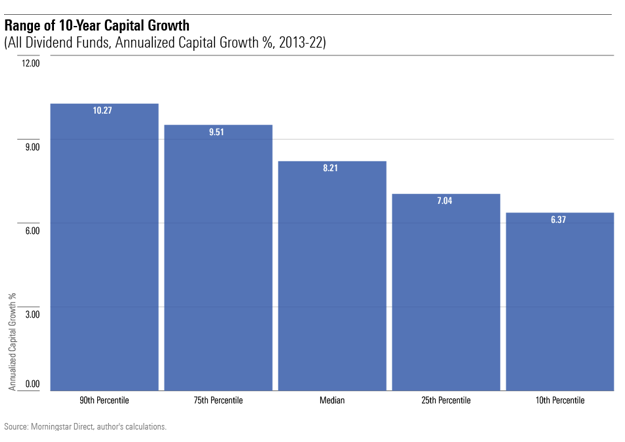
These are healthy figures. At the 90th percentile mark, dividend funds have expanded their capital bases by 10.27% per year, for a cumulative gain of 166%. (Their total returns, which include their dividend receipts, are even fatter.) Good work if you can get it! Even the 10th percentile figure offers some comfort, as it represents an 85% increase, although those investors missed an opportunity. Had they invested in other dividend funds, they would be wealthier yet.
The next logical step is to combine current income and capital growth, by calculating what each dividend fund pays based on an earlier investment. That is, rather than show the yield that new investors receive, as the current income chart does, the next exhibit shows the yield obtained by investors who bought their shares in January 2013. This figure, which is stated as a percentage of the original purchase price, incorporates both current income and subsequent growth.
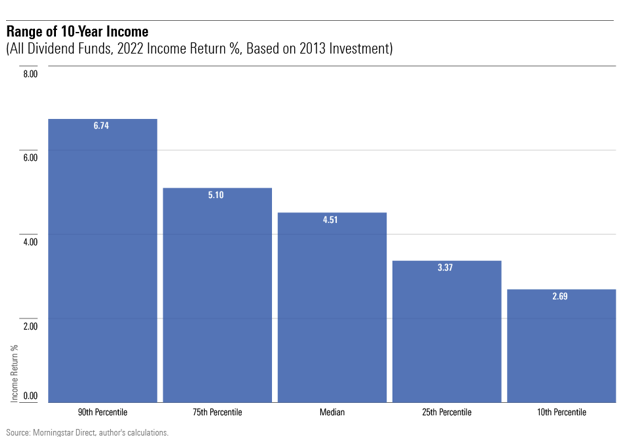
This range is greater than that of capital growth alone. There is a big difference between the 6.74% distribution rate enjoyed by shareholders who 10 years ago invested in a 90th-percentile fund, and the relatively paltry 2.69% yield received by those in a 10th-percentile fund. The former can be exceeded only by high-risk bond funds, while the latter cannot even match today’s Treasury-bill payouts.
This information can be used to create two best-funds tables, reflecting the split between funds that seek high current yield and those that favor capital growth. I call the first list “income funds” and the second “total return funds.” (Never accuse me of having an overactive imagination.) Each list scores funds according to 1) their income growth and 2) their expense ratios. Then, income funds are also evaluated by their current income, while total return funds are measured by their capital growth.
Two funds appear on both tables. Appearing in bold type, they should appeal to all dividend-fund investors, regardless of their goals. Finally, all the listed funds are ETFs. As it turned out, no mutual fund could overcome its expense handicap.
Below are the income funds.
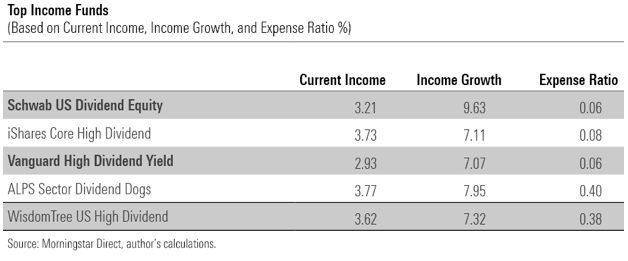
(Note: I do not provide the various fund ranks, as I find it more useful to show the fund results. But rest assured, the funds are presented in the correct order. Of the 68 dividend funds that existed from 2013 through 2022, Schwab U.S. Dividend Equity SCHD (
Now, let’s see the total return funds.
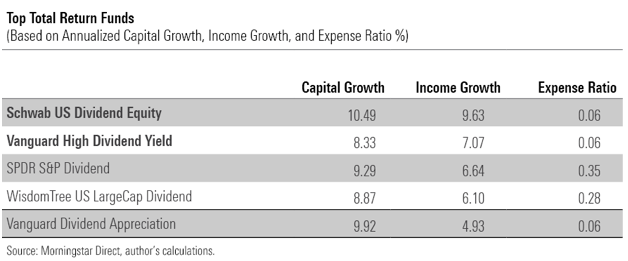
As there are eight funds in total, I will round out the winner’s list by providing two honorable mentions. Vanguard Dividend Growth VDIGX (
Photo by Markus Winkler on Unsplash