

Summary
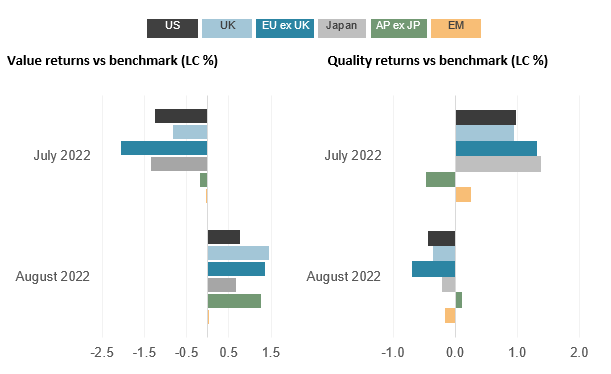
- Value stocks have been on a wild ride lately, badly lagging the broader market indexes and the growth-heavy Quality factor in the global rally in July, only to recapture most of their performance edge in the August swoon.
- These sharp swings and what drove them hold important implications for asset allocation decision-making in the likely turbulent months ahead.
- The gyrations in Value and Quality returns in July and August were particularly pronounced in the US and Europe ex UK, which led global stock markets higher in July but suffered the biggest declines in August.
Value stocks have been on a wild ride lately, badly lagging the broader market indexes and the growth-heavy Quality factor in the global rally in July, only to recapture most of their performance edge in the August swoon. These sharp swings and what drove them hold important implications for asset allocation decision-making in the likely turbulent months ahead.
As shown below, the gyrations in Value and Quality returns in July and August were particularly pronounced in the US and Europe ex-UK, which led global stock markets higher in July but suffered the biggest declines in August.
Source: FTSE Russell. Data as of August 31, 2022. Past performance is no guarantee to future results. Please see the end for important disclosures.
Value, along with its sister factor Dividend Yield, remained the top performers for the year to date (as shown in the bar chart below) and the 12-month span, providing ballast over the course of an extremely tough period for stock markets globally.
Regional equity benchmark returns – YTD ended August 31, 2022 (TR, LC %)
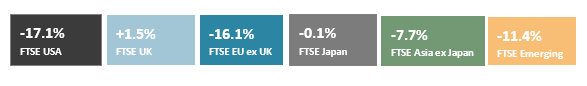
Regional factor returns relative to local benchmark – YTD ended August 31, 2022 (TR, LC %)

Source: FTSE Russell. Data as of August 31, 2022. Past performance is no guarantee of future results. Please see the end for important legal disclosures.
Value still holds the reins
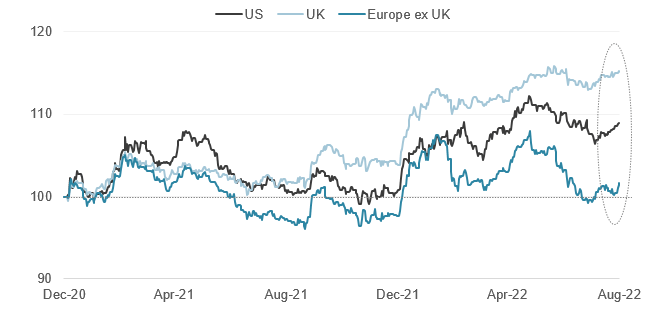
As the graphic below illustrates, the global rotation into Value from Quality that began with the vaccine rollouts and reopening euphoria in early 2021 went into overdrive this year.
This leg of the Value rotation, however, has come amid a much grimmer macroeconomic and equity-market backdrop than that earlier run, as stubbornly high inflation (intensified by supply-side constraints caused by the Russia-Ukraine war and renewed Covid lockdowns in China) provoked aggressive tightening cycles at most central banks.
Overall, the runups in commodity prices, inflation and interest rates this year has generally buoyed Value and hurt growth-heavy Quality.
Though Quality has enjoyed periodic bursts of strength, particularly this summer, it has failed to make much progress since the rotation began, particularly in the UK.
Regional Value vs Quality returns relative to local market (LC, rebased)
Source: FTSE Russell. Data as of August 31, 2022. Past performance is no guarantee of future results. Please see the end for important legal disclosures.
Avoiding the ‘tech wreck’ a prime Value driver
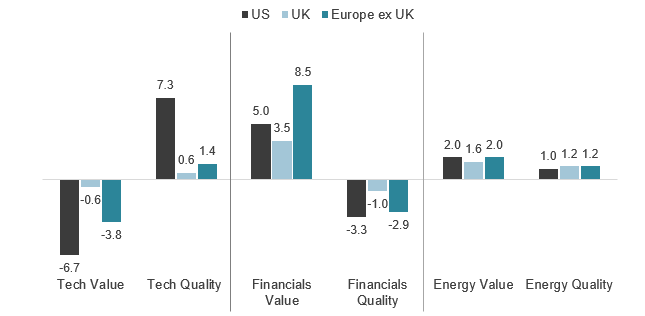
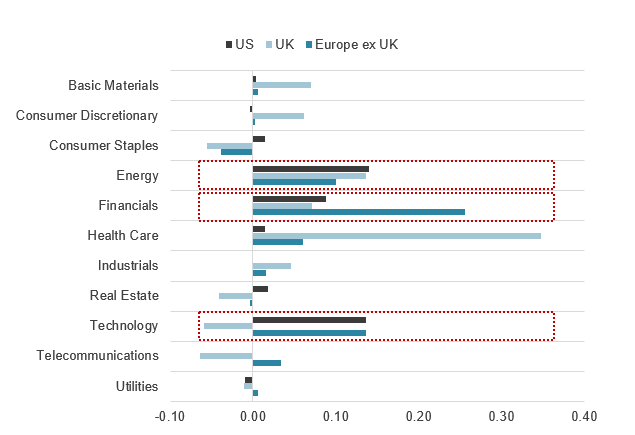
A major catalyst of Value outperformance in the US and Europe was the factor’s low exposure to the continued downdraft in high-growth stocks in August: the Value factor is underweight technology by roughly 7% and 4% in the two markets, respectively.
In contrast to other markets, tech stocks rose in the UK in August. However, the UK tech industry is tiny, so its Value and Quality exposures are close to those of the benchmark, significantly dampening the factor effects of tech stock performance.
Select Value and Quality Industry Active Weights (%) – as of August 31, 2022
Source: FTSE Russell. Based on Industry Classification Benchmark (ICB) data as of August 31, 2022. Past performance is no guarantee of future results. Please see the end for important legal disclosures.
Value also broadly benefited from its overweights in energy and financials: the former was one of the few industries to post gains across markets in August, while the latter group was relatively resilient globally. Value’s low to neutral exposures to the declines in health care stocks was another contributor to outperformance, particularly in the UK.
Value industry allocation effects vs benchmark (%) – One month ending August 31, 2022
Source: FTSE Russell. Based on Industry Classification Benchmark (ICB) data as of August 31, 2022. Past performance is no guarantee of future results. Please see the end for important legal disclosures.