

- SPDR Portfolio S&P 500 High Dividend ETF offers a 4.65% dividend yield and is administered by State Street Global Advisors.
- SPYD tracks the S&P 500 High Dividend Index and includes a higher representation of mid-cap stocks compared to other dividend-focused ETFs.
- Despite its high dividend yield, SPYD’s performance and risk/reward profile are inferior to other competitive options such as Vanguard High Dividend Yield ETF (VYM) and iShares Core High Dividend ETF (HDV).
As far as I can tell, in all the years I have written almost exclusively about ETFs here on Seeking Alpha, I have never had the opportunity to review SPDR Portfolio S&P 500 High Dividend ETF (NYSEARCA:SPYD
On the surface, for an investor interested in a solid stream of dividends, there might appear to be much to recommend SPYD. After all, its administrator is State Street Global Advisors, Inc., the same firm that administers the venerable SPDR S&P 500 ETF Trust (SPY
What, then, am I referring to when I say that I never knew a 4.65% yield could come at such a high price? Let’s dig into the details, shall we? I think you will start to see what I mean.
SPYD: Underlying Index and Methodology
SPYD seeks to track the performance of the S&P 500 High Dividend Index. This index is designed to measure the performance of the highest dividend-yielding companies within the S&P 500 Index. I should note here that, beyond a simple mathematical equation, there is only one “judgment” filter that is applied, as far as I can tell. Here, as a direct quote from the index construction document, is the methodology and key details.
At each rebalancing, the index selects 80 constituents from the eligible stocks in the index universe according to the following process:
- Rank the eligible stocks in descending order by 12-month IAD (indicated annual dividend) yield.
- Automatically select all securities ranked within the top 64.
- Select current constituents ranked within the top 96 in rank order, until the target stock count is reached .
- If at this step the target count is still not satisfied, select the highest-ranked non-constituents in rank order until the target stock count is reached.
At the discretion of S&P Dow Jones Indices, a company may be excluded, or not considered for membership, at a semi-annual rebalancing if S&P Dow Jones Indices determines the company’s 12-month indicated dividend yield to be unsustainable. (Bold mine, for emphasis)
At each rebalancing, constituents are equal-weighted.
With that, let’s briefly talk about some of the implications of this, as compared to other dividend-focused ETFs you might consider.
First off, in a previous article comparing two Vanguard ETFs, I featured the fact that Vanguard has a nice ETF comparison tool on its advisors website. One feature of this tool is what Vanguard refers to as Style Boxes. Basically, these graphically represent the breakdown of the types of equities included in the particular ETF. Here they are for SPYD and Vanguard’s competitive offering, Vanguard High Dividend Yield ETF (VYM
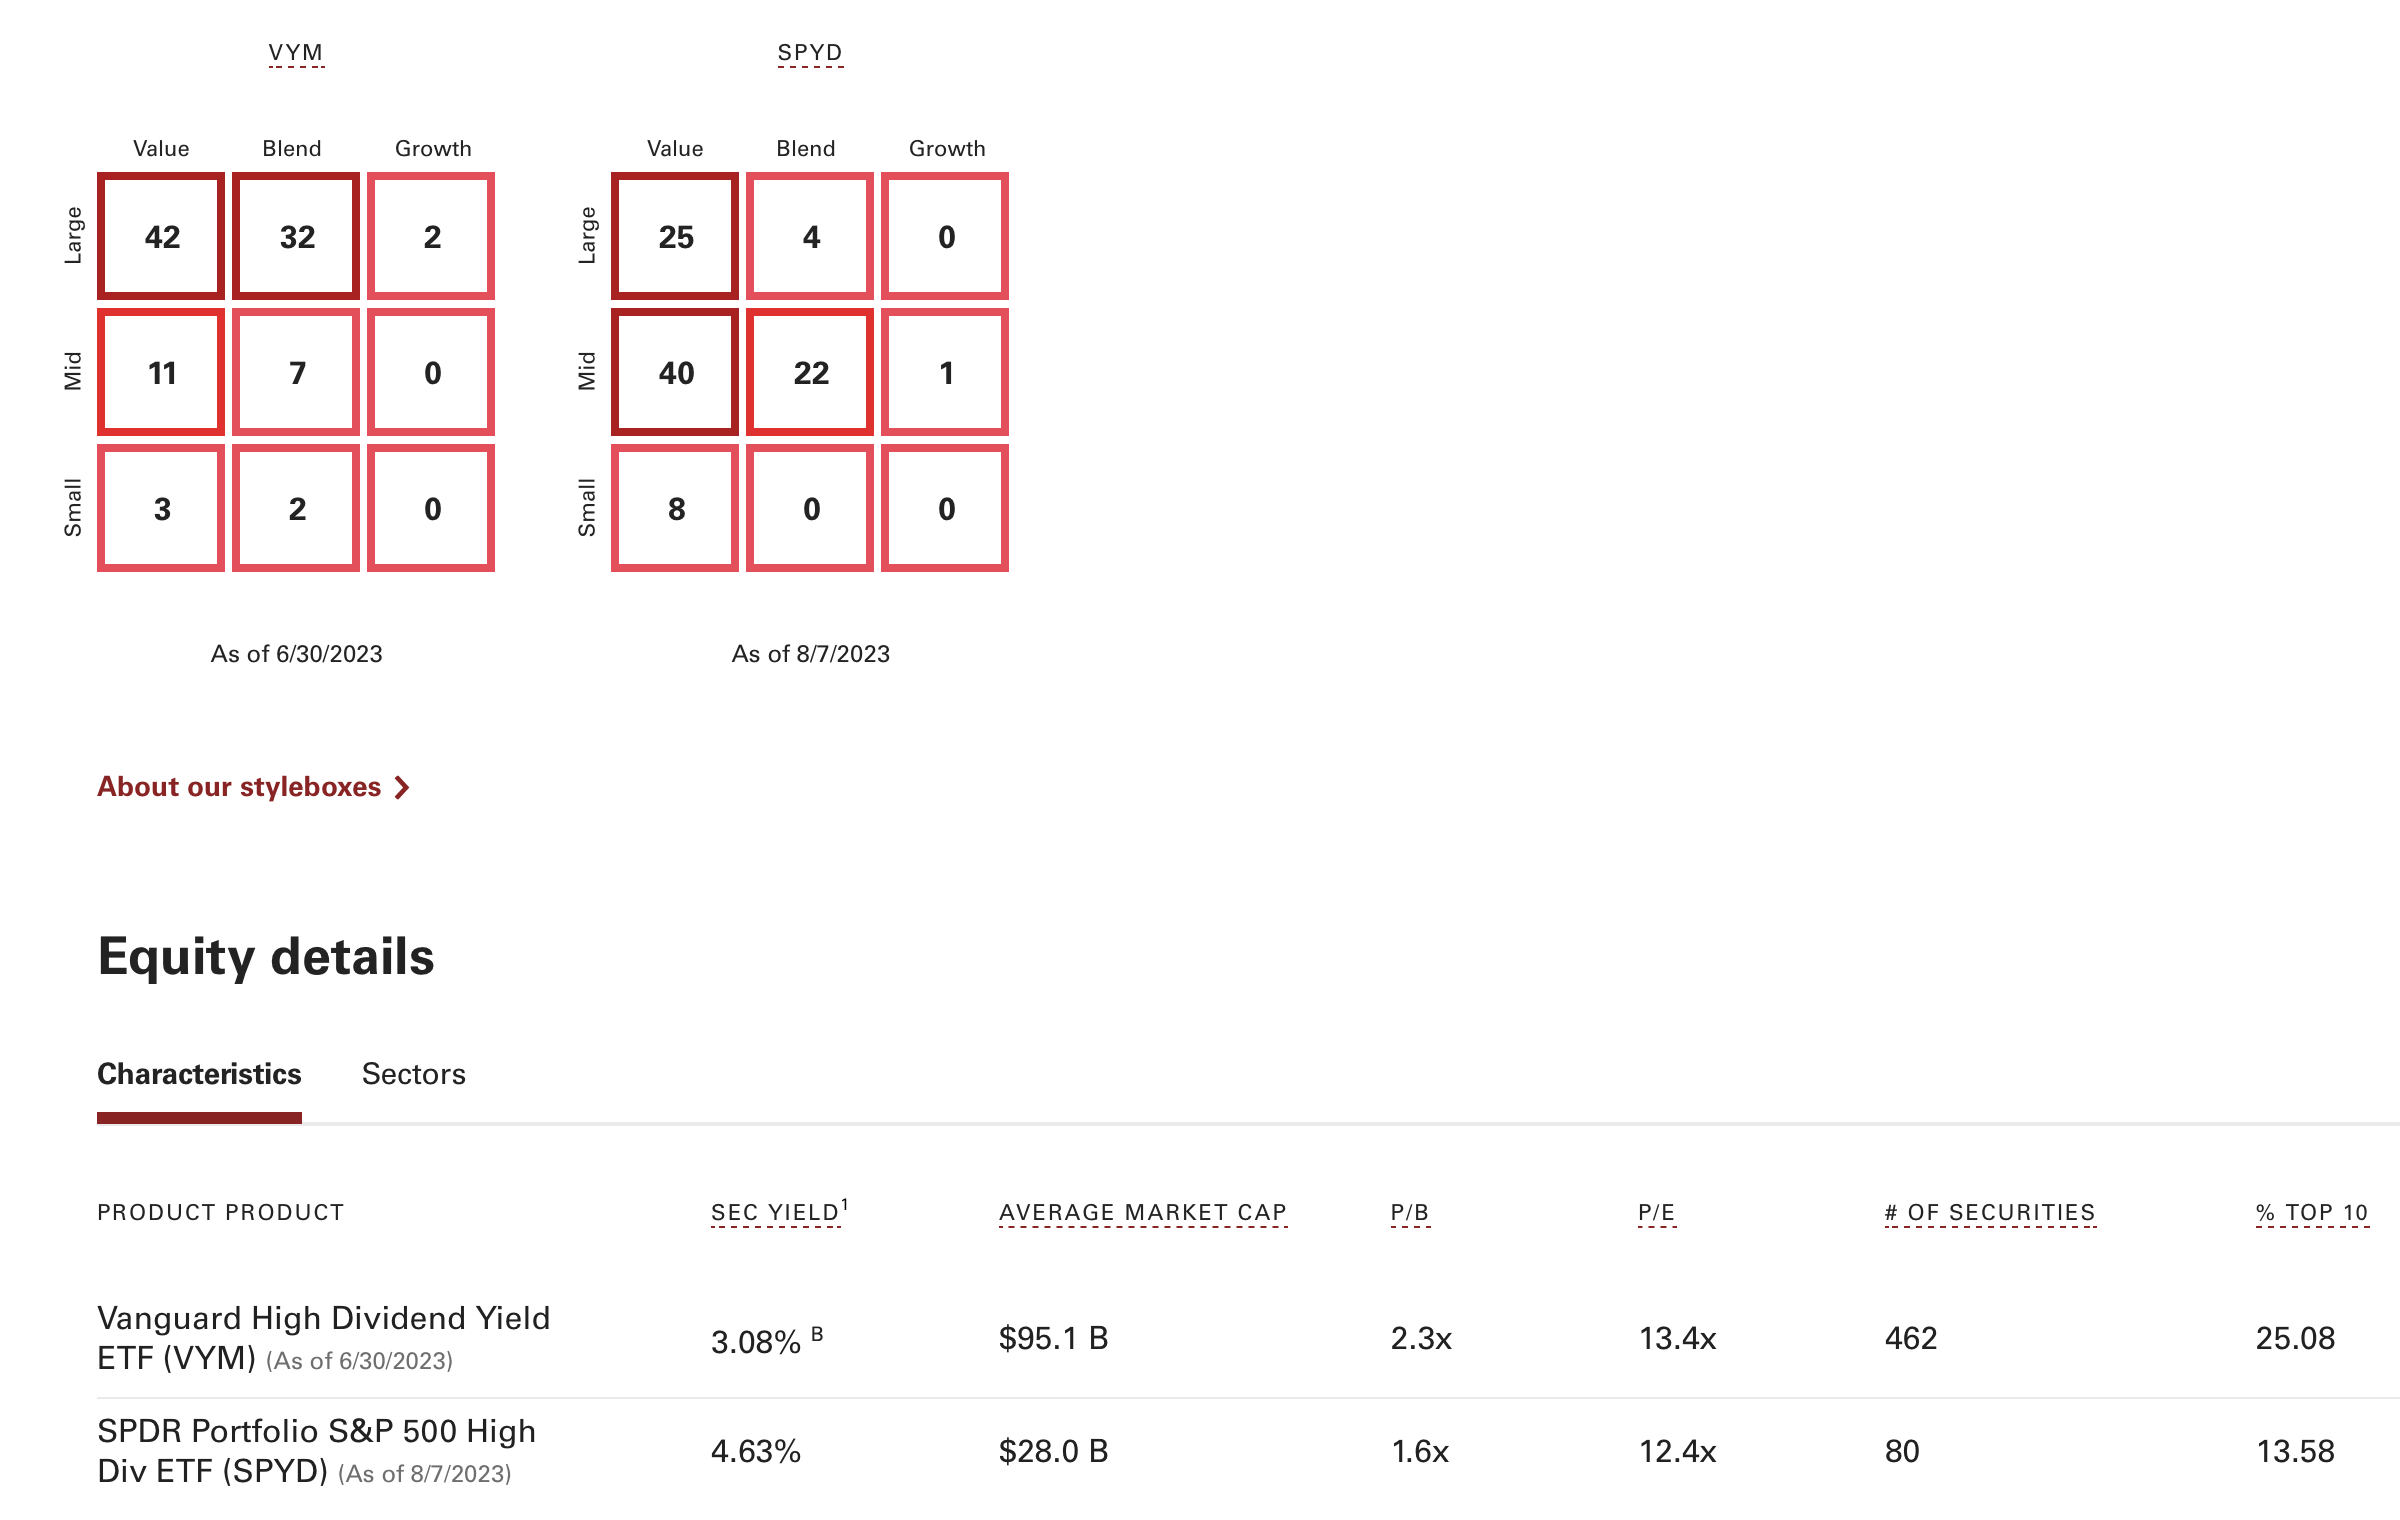
With the assistance of this graphic, allow me to point out three things:
- As can be seen, SPYD contains a far greater representation of mid-cap stocks in particular. You might notice that some 76% of VYM’s constituents fall in the large-cap category, where only 29% of SPYD’s constituents fall here, with some 61% falling into the mid-cap category. You can also see this play out if you look at the comparative average market cap in the Characteristics section at the bottom.
- As opposed to VYM’s market-cap weighting approach, SPYD goes with equal-weighting. Take a look at the comparative Top 10% numbers for VYM and SPYD and you will see this playing out. Despite far fewer holdings, SPYD’s Top 10 ratio is a mere 13.58%
- While you will not see this in the above graphic, there is one huge difference in the sector allocations of SPYD vs. most other dividend-focused ETFs. Specifically, that SPYD includes REITS. In fact, you might be surprised to know that some 21.3% of SPYD’s holdings are also in Vanguard Real Estate ETF (VNQ
.
I will talk a little about that last detail in the next section, when we get into performance and, quite frankly, why you might well be better off using VNQ to incorporate whatever portion of real estate you desire in your portfolio.
SPYD’s High “Price” – Comparative Performance
While taking note of what might at first glance appeared to be some real positives of SPYD—including that 4.65% dividend yield—the more I dug into various competitive options the more it became apparent that SPYD’s shareholders have paid a price in terms of performance. And when I talk about performance, I’m not merely talking about absolute performance in terms of total return but also the risk/reward profile. I don’t know how else to put it except that you can do better elsewhere.
To give you two specific examples of what I mean, I will next share the results of two separate backtests I performed using the tools at Portfolio Visualizer. In each case, I will include a link so you can verify each backtest for yourself if you so desire.
In each case, the backtest runs from January, 2016 to the present, limited by the inception date of SPYD. All income is reinvested and, in the case of the second backtest involving a competitive 2-ETF combo, the portfolio was rebalanced annually, just to keep everything as closely-matched as possible.
So here is the first backtest. For this one, I picked VYM, already referenced above, as well as iShares Core High Dividend ETF (HDV
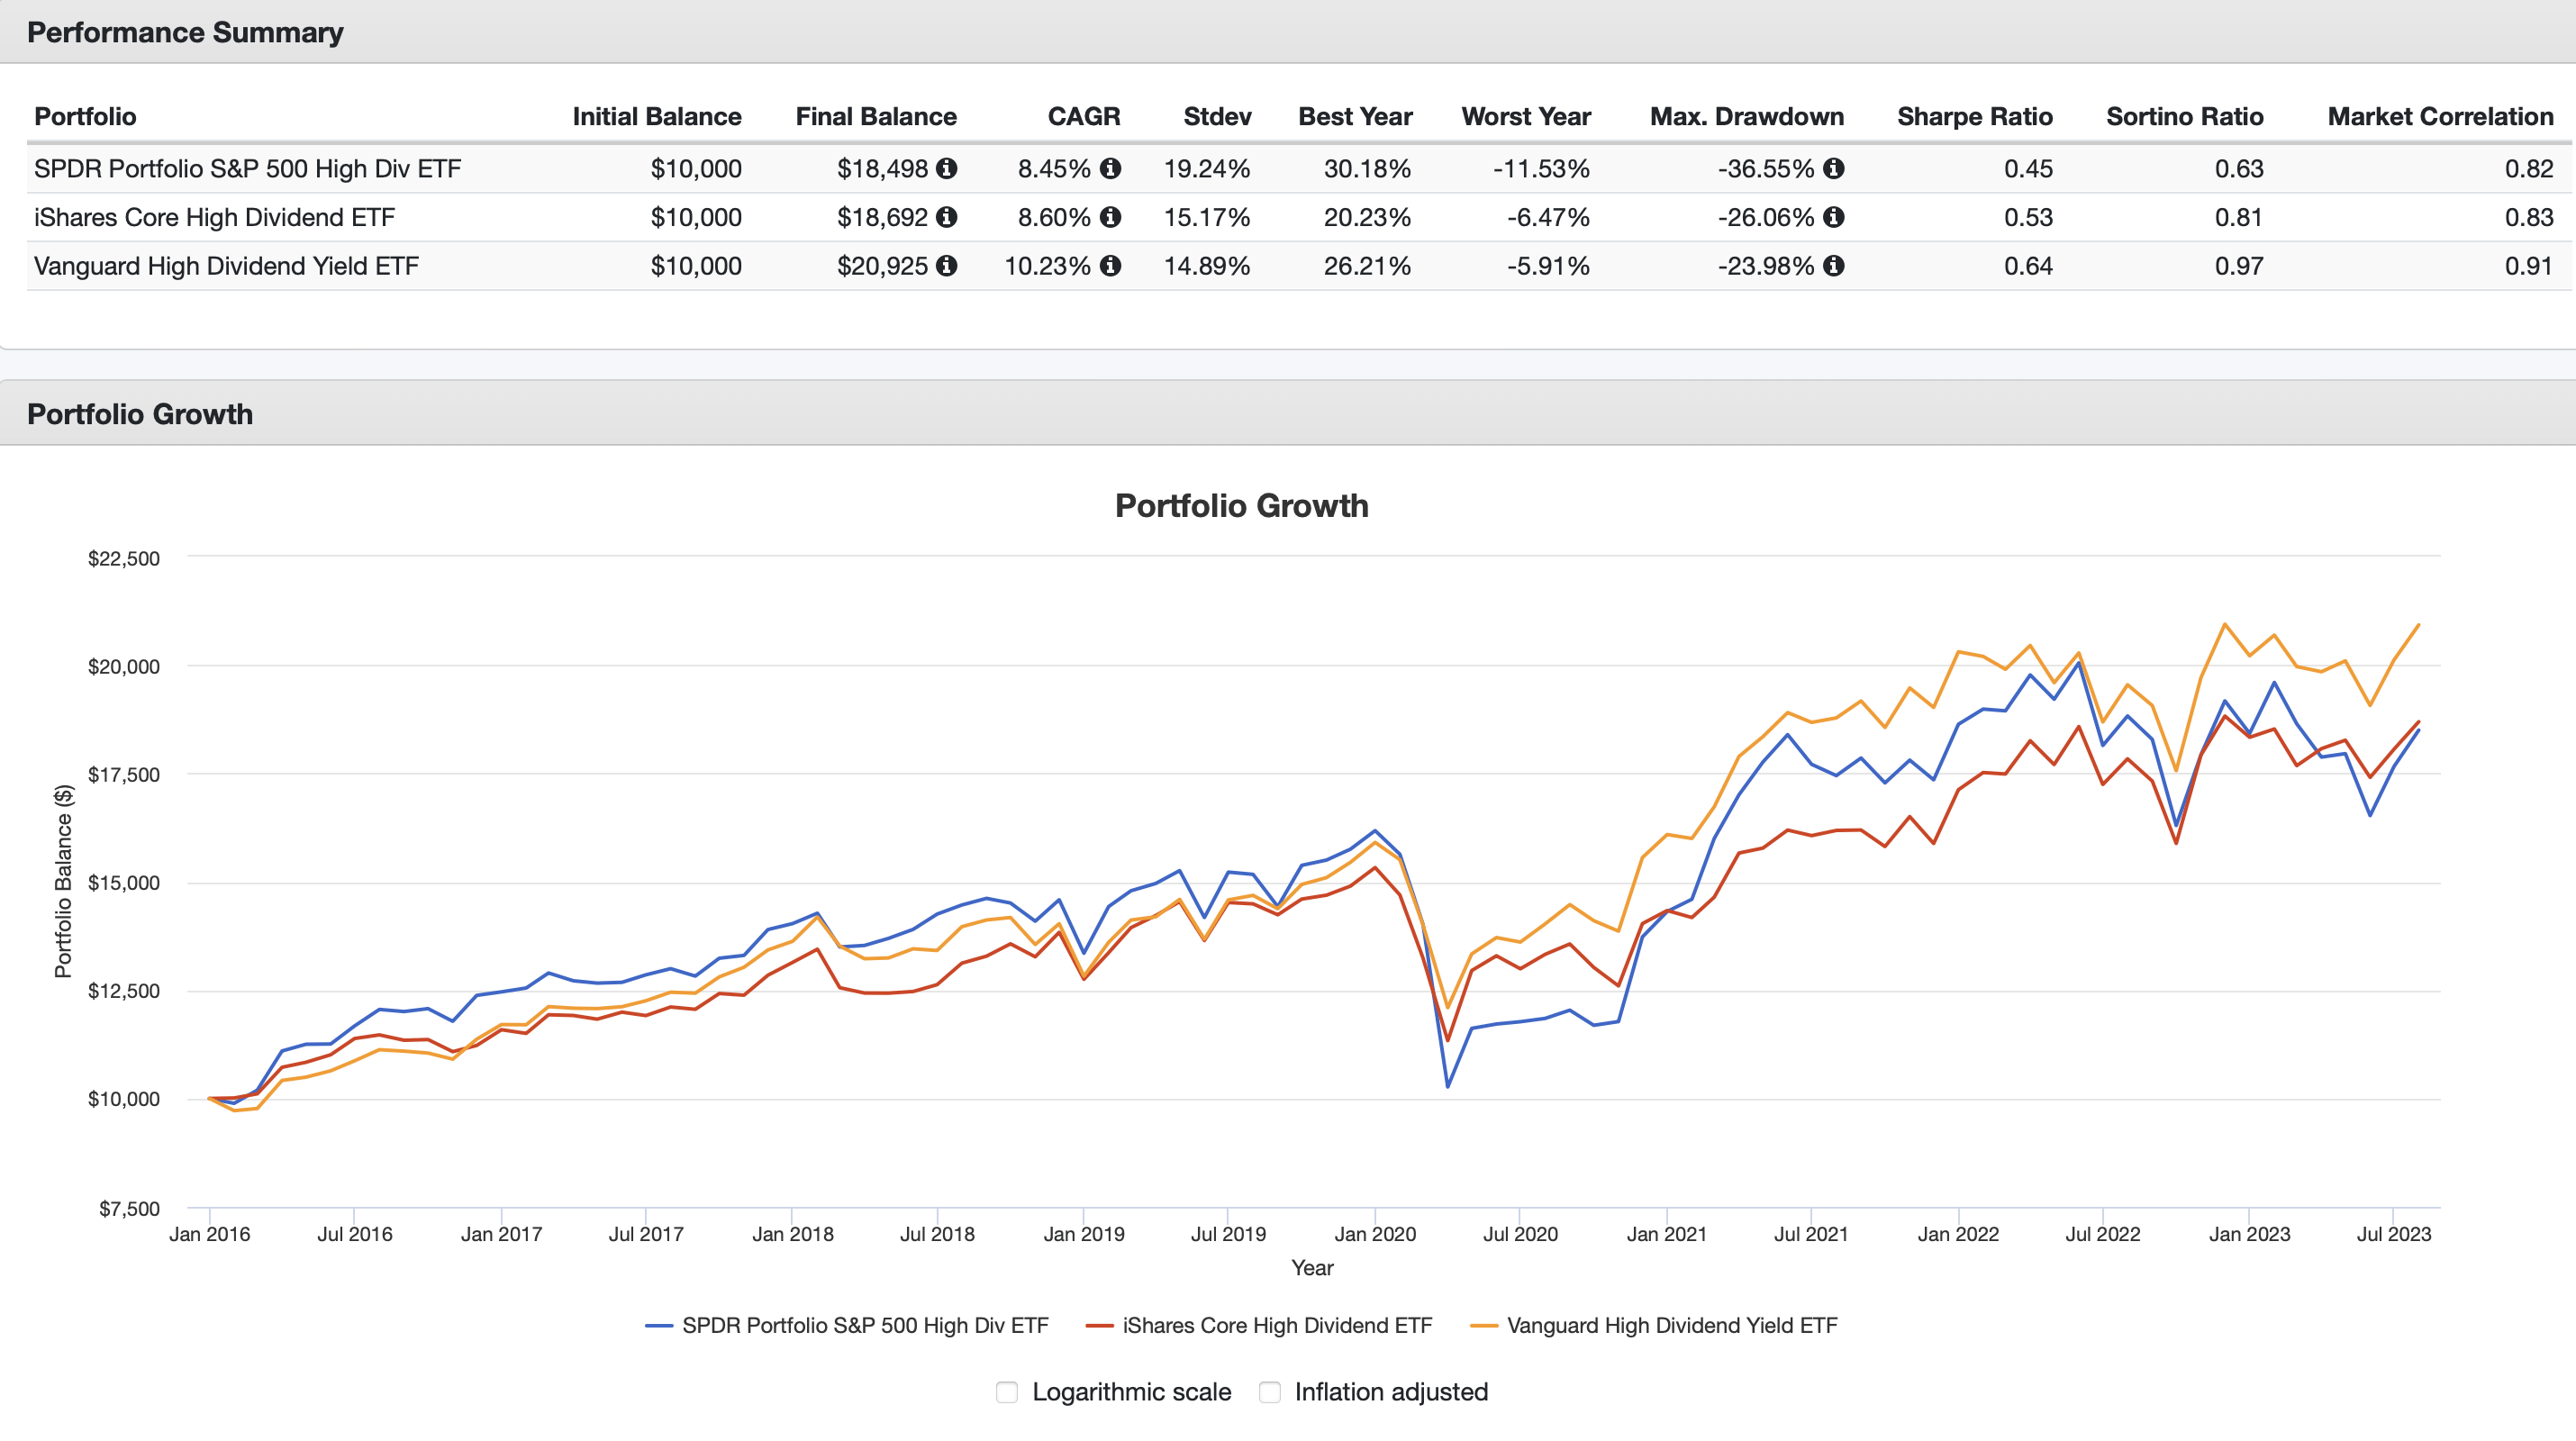
Now here’s the thing. Honestly, I picked HDV on purpose, as an example of a somewhat average high-dividend ETF. As you can see in the above backtest, however, HDV quite handily bests SPYD. While the absolute returns of the two ETFs are very similar, please note that HDV did it with much less volatility, as reflected in the Worst Year and Max Drawdown values, along with the respective Sharpe and Sortino ratios. And VYM? It outperformed both.
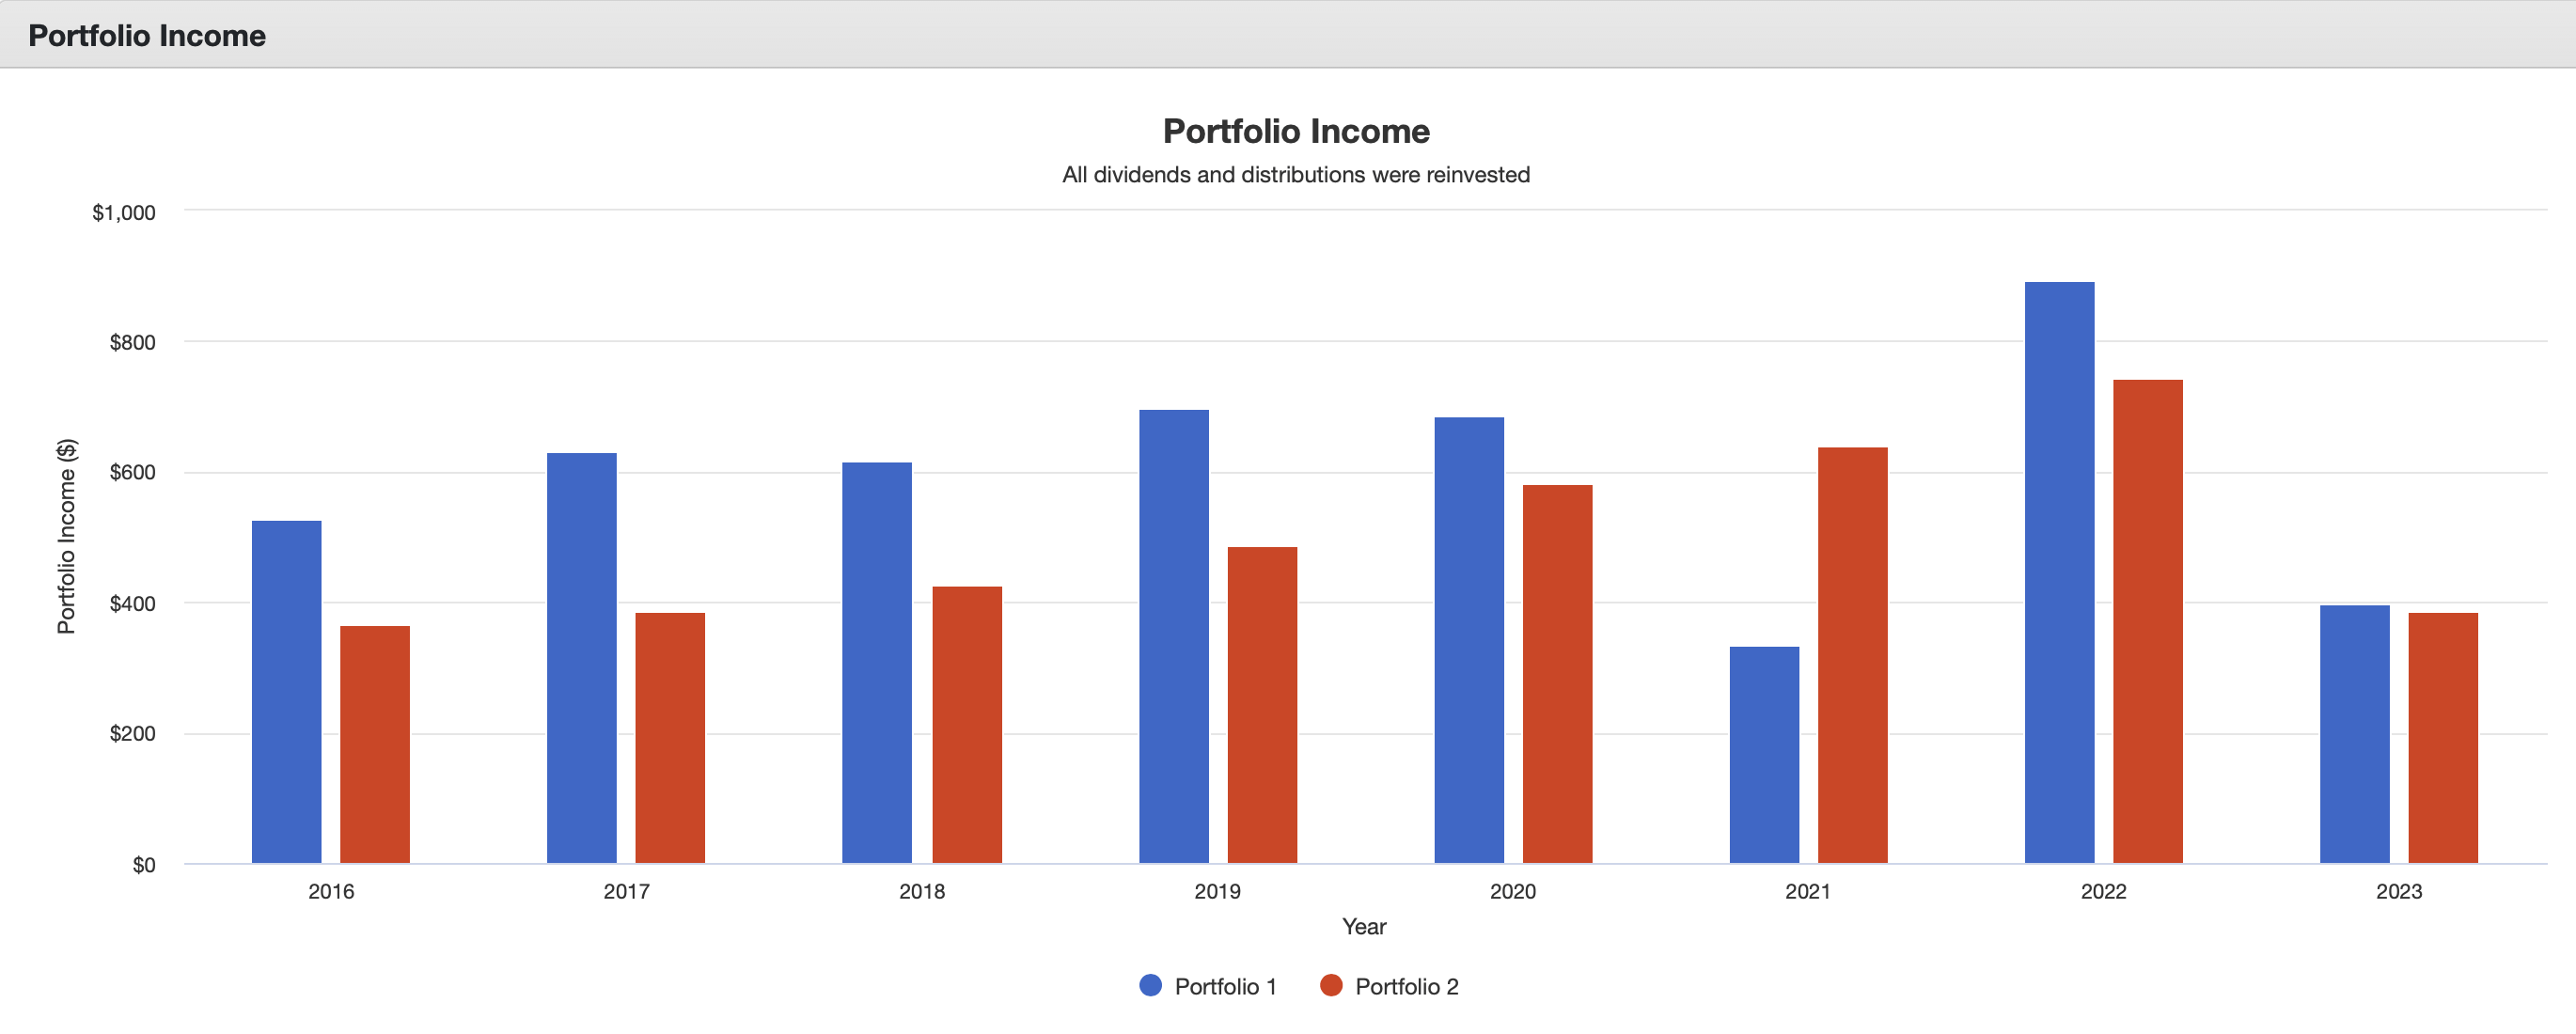
Now, to be fair, have a look at the income generated by all 3 ETFs.
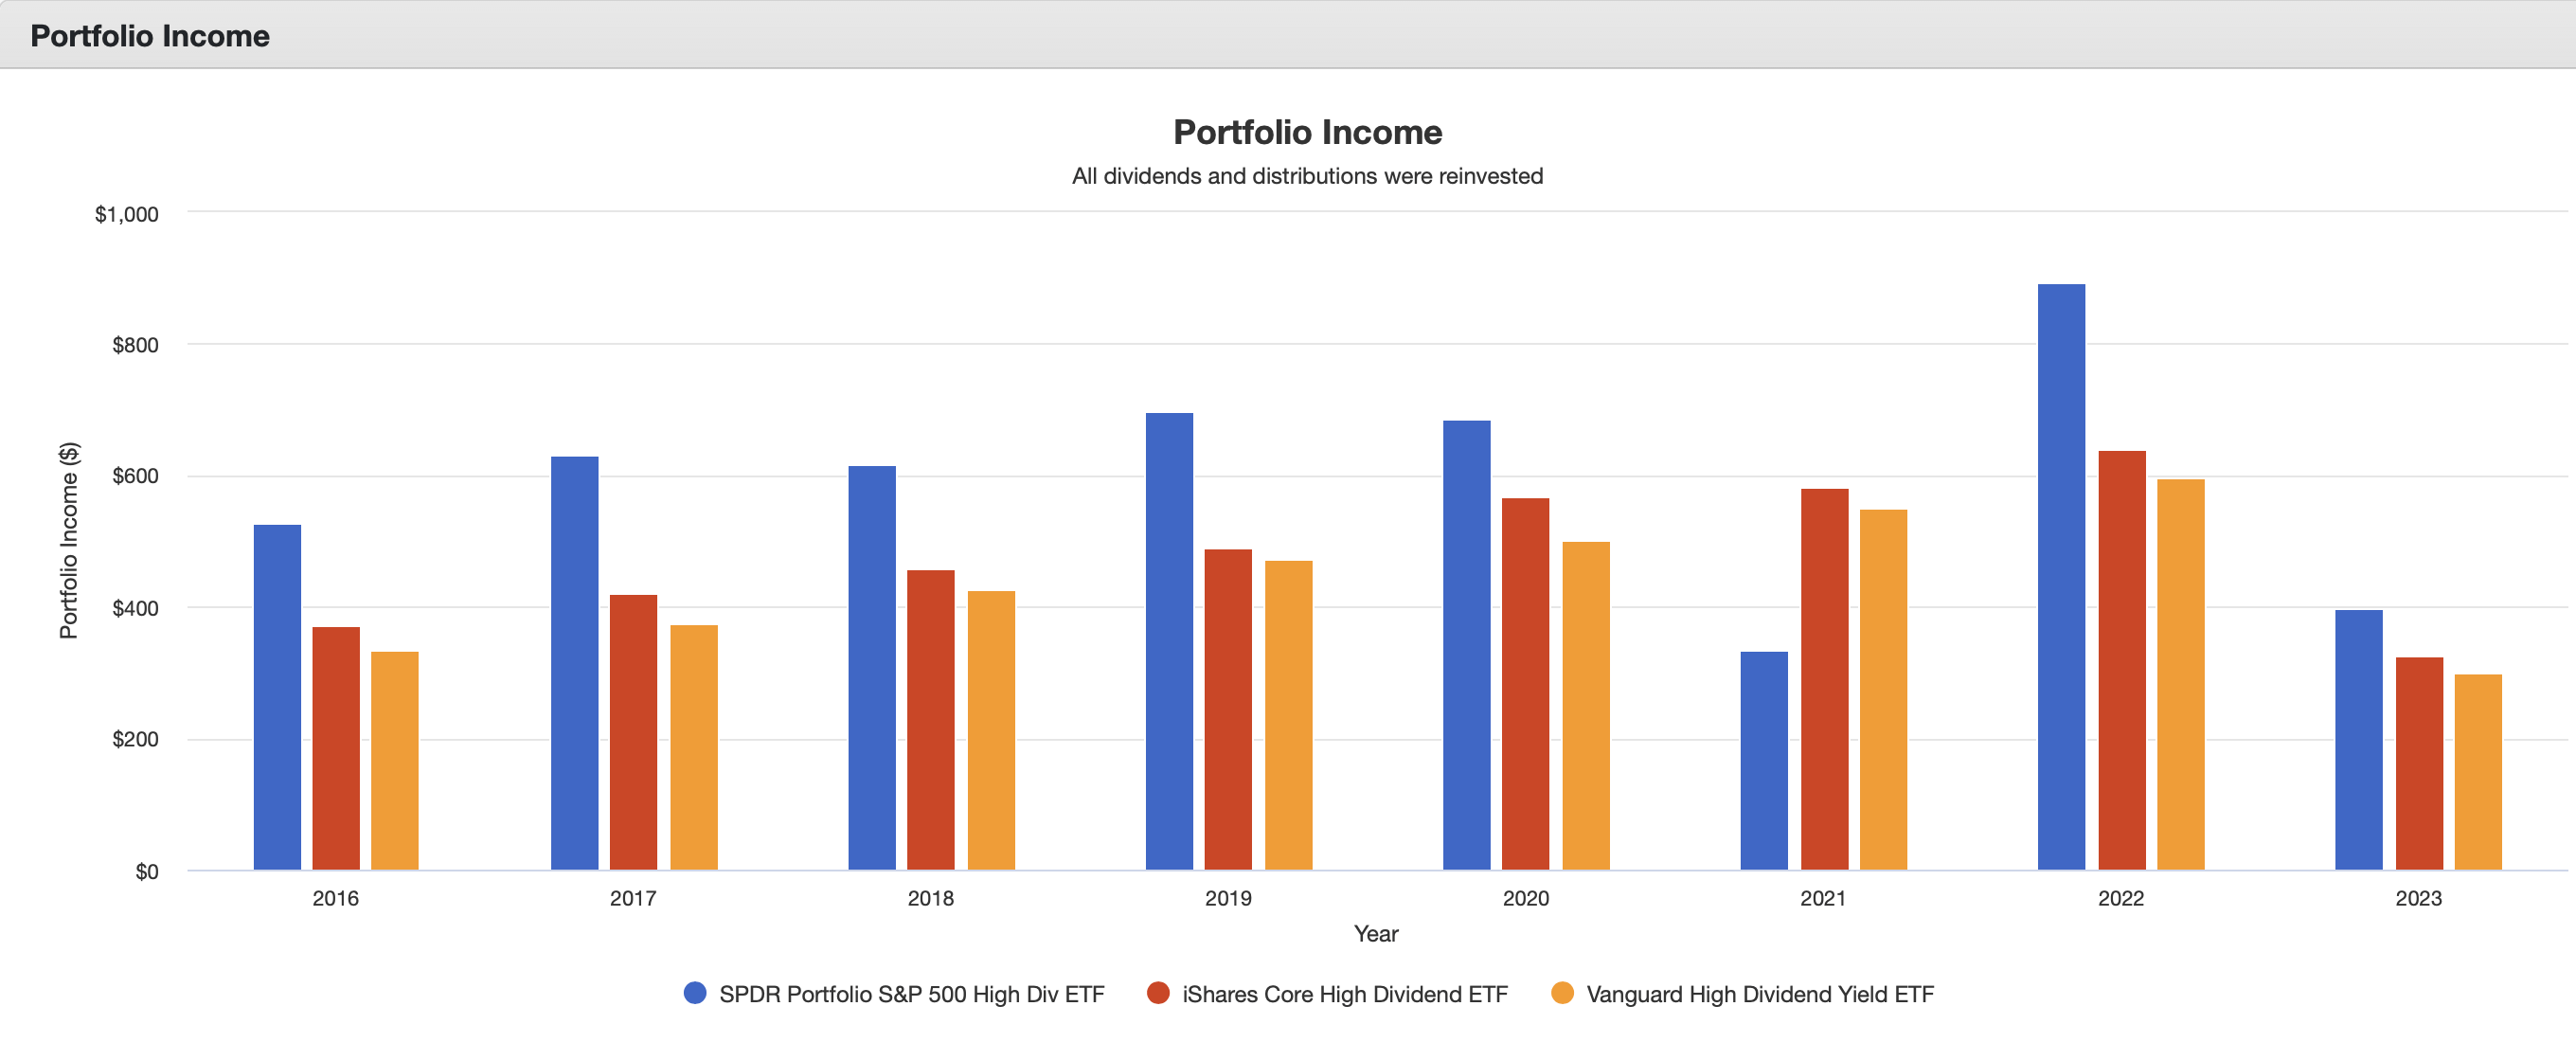
As can be seen, SPYD does come out the winner here. So, if that is the only thing that matters for a particular investor, perhaps SPYD is a solid selection. But please bear in mind that all of the results in the first graphic include reinvested dividends. So, for example, one could have easily sold small amounts of VYM to make up for any income shortfall, if that was important, and still come out ahead.
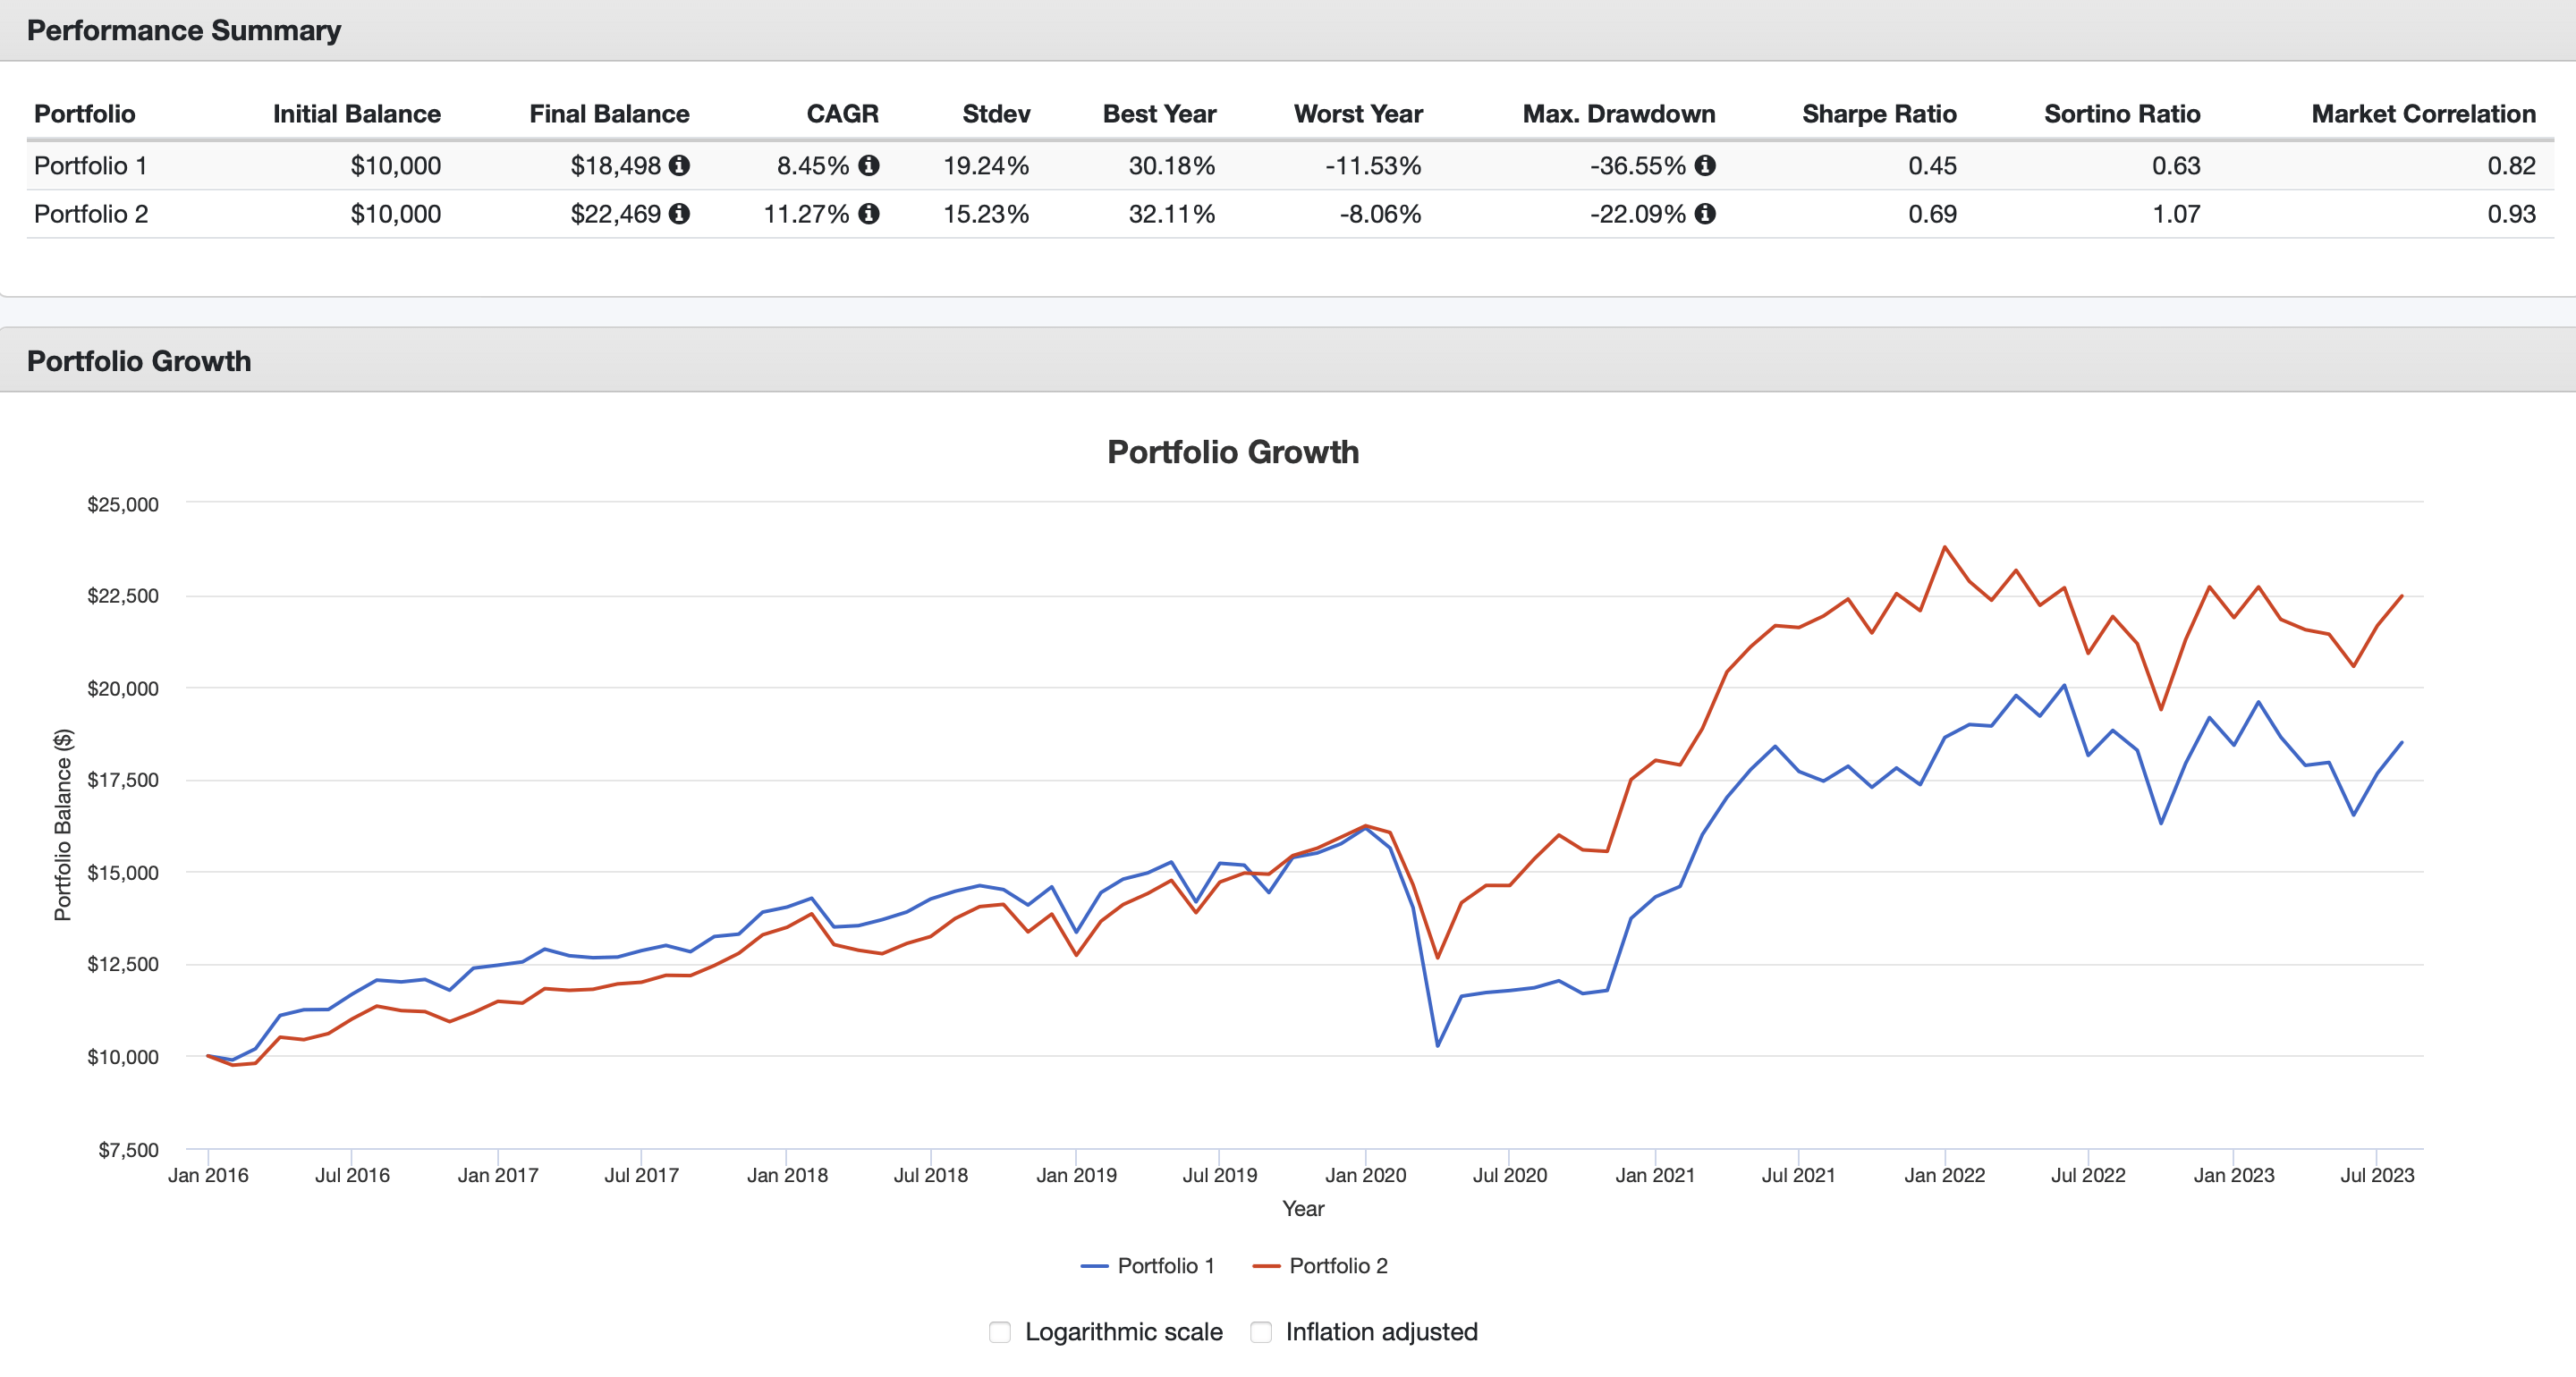
Now to the second backtest. Earlier, I mentioned that SPYD was somewhat unusual among its competitors in that it includes allocation of roughly 21% to REITS. REITS have somewhat of a different risk/reward profile than do other stocks, as they by definition own real estate and are also required by the tax code to distribute 90% of taxable income in the form of shareholder dividends each year. So to compare it to HDV and VYM is, at some level, not really an “apples to apples” comparison.
So, I decided to use perhaps the most admired dividend ETF on the market, Schwab US Dividend Equity ETF (SCHD
Again, have a look. First, the overall results.
And then, the income.
I think by now you see where I am going. Simply put, better returns, less volatility.
But even more than that, unless you have everything in tax-deferred or tax-exempt accounts, there are valid tax reasons to separate your investment in REITs. Unlike common stocks, REITs are not eligible for preferred dividend tax rates. Therefore you want to make every effort to, at the very least, place an ETF like VNQ in a tax-deferred or tax-exempt account.
Summary and Conclusion
Readers who have followed me for any length of time know that I generally try to find the positive in any ETF I am reviewing.
Other than the fact that SPYD has established at this point a solid track record of throwing off a solid amount of income, however, I’m struggling to find anything positive to feature.
The downside of an approach which more or less simply picks companies by the amount of dividends paid is that you are, at the very least, picking the slowest growers and, at the very worst, possibly including some that are in some level of financial distress.
It just seems like, with all the competitive options out there, you can do better.
Photo by Elisa Ventur on Unsplash