

Summary
- SPDV is a high-dividend ETF yielding 4%, and is one of the few ETFs to take an equal-weight-by-sector approach. Fees are 0.29% and the ETF has $65 in AUM.
- The approach is logical, but winds up selecting stocks with low growth and of the “deep value” variety. Consequently, SPDV’s track record is poor compared to peers like SCHD.
- In addition to examining SPDV’s fundamentals, this article considers the earnings season ahead for its constituents. I’ll highlight the risks some names facing that are scheduled to report soon.
- SPDV may work for income investors, but for those desiring income plus decent capital appreciation protection, I recommend passing on it.
Investment Thesis
The AAM S&P 500 High Dividend Value ETF (NYSEARCA:SPDV
ETF Overview
Strategy Discussion
SPDV tracks the S&P Dividend and Free Cash Flow Yield Index, taking an equal-weight-by-sector approach by selecting 55 S&P 500 companies across all 11 sectors. This approach protects investors from over-concentration, which I recently highlighted in my criticism of the First Trust Rising Dividend Achievers ETF (RDVY
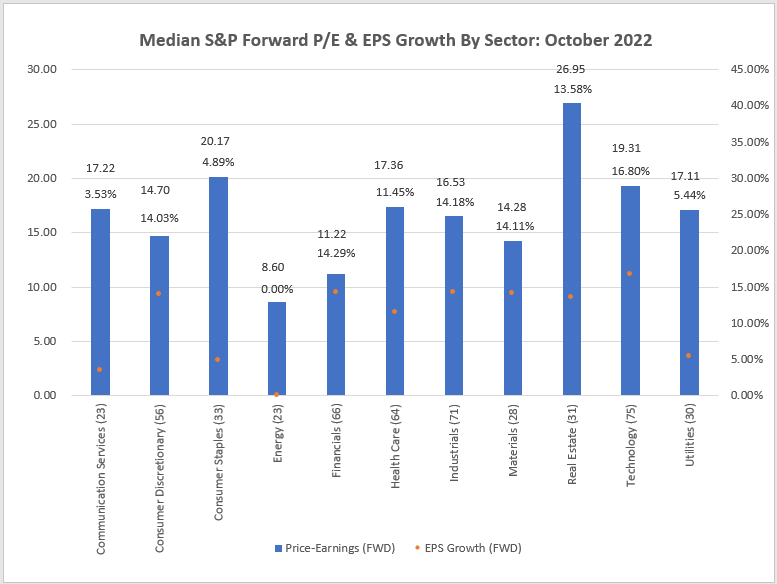
Furthermore, the sample sizes for Technology, Industrials, and Financials are large (75, 71, and 66), so these sectors enjoy a comparative advantage in rules-based portfolios that select from the S&P 500. However, SPDV’s equal-weight-by-sector approach strips away that advantage, which, theoretically, should result in a more fair portfolio.
SPDV’s two key screens are its forward dividend yield and trailing free cash flow yield, defined as free cash flow per share divided by the company’s stock price. Reconstitutions occur semi-annually in January and July, and the ETF has a 0.29% expense ratio along with a high 0.26% median bid-ask spread that will add to the cost of trading.
Sector Exposures and Top Holdings
Each sector has an approximate 9% weighting, and the differences shown below merely reflect the performances of each sector since the latest semi-annual rebalancing in July. The ALPS Equal Sector Weight ETF (EQL

The equal-weight-by-sector approach significantly cuts investors’ exposure to Technology and Health Care in favor of Energy, Materials, Real Estate, and Utilities. These weights align closer with my preference for inflation-friendly sectors in this environment. Still, the drastic reduction in Technology stocks effectively reduces the portfolio’s overall quality. SPY’s largest 15 Technology holdings all have perfect “A+” Seeking Alpha Profitability Grades. Since SPDV holds only two of these (CSCO and IBM), it represents a bet against some of these top performers over the last decade. I’m not convinced either approach is ideal.
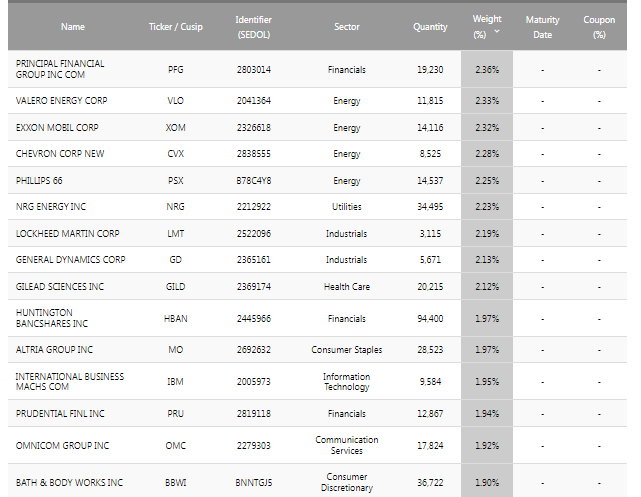
A look at SPDV’s top holdings would reveal much because of its weighting scheme, but the list below provides a nice sample. Principal Financial Group (PFG) and a slew of Energy stocks like Exxon Mobil (XOM) and Chevron (CVX) are at the top. Missing are representatives from the Consumer Discretionary, Materials, and Real Estate sectors, which include companies like Bath & Body Works (BBWI), Amcor (AMCR), and Simon Property Group (SPG).
Performance Analysis
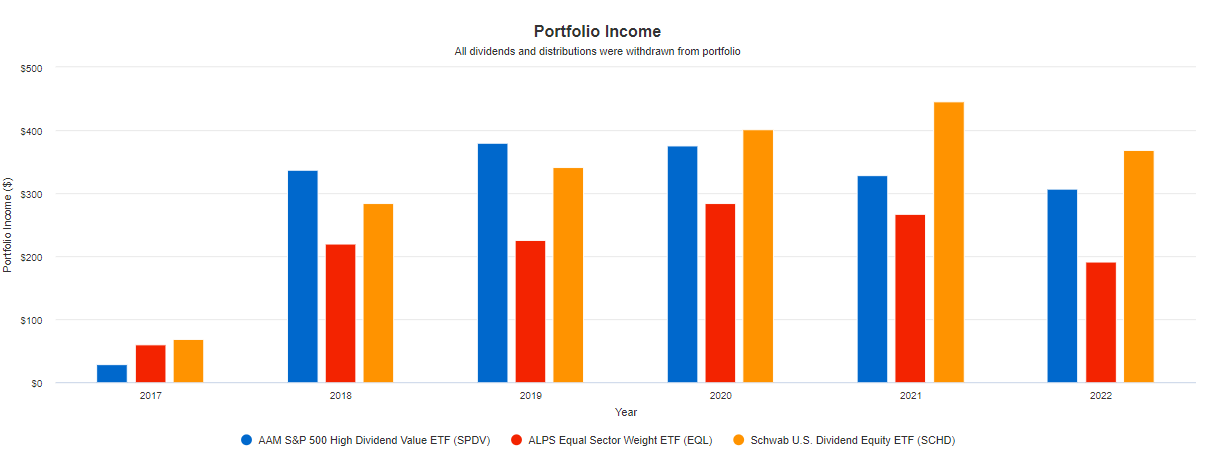
SPDV launched nearly five years ago, and although its $65 million in net assets is relatively small, the fund has experienced significant growth over the last two years. According to the latest semi-annual report, SPDV had $23.8 million in net assets on October 31, 2020, $45.6 million one year later, and $60.6 million on April 30, 2022. Perhaps investors are starting to appreciate the straightforward approach and high dividends, but let’s look at how it performed against some of its peers, including SCHD, a fellow high-dividend ETF with an expense ratio of just 0.06%.

SPDV has gained an annualized 4.39% since December 2017, significantly lagging its peers. EQL, which represents a straightforward alternative with no screens, outpaced SPDV by 3.51% per year, and SCHD, which currently offers a 3.53% trailing yield, has beaten SPDV by an annualized 5.55%. Furthermore, SPDV has experienced higher volatility as measured by standard deviation, so it’s a bit puzzling how the ETF continues to attract new money.
Perhaps it’s as simple as the high-yield component. SPDV’s 3.92% trailing yield is attractive, but even without reinvesting dividends, it would only take a few years for SCHD investors’ yield on cost to catch up. Capital appreciation is needed to support strong dividend growth. Dividend growth also requires solid sales and earnings growth, which often translates into higher stock prices. Reaching too deep into the high-yield pool, as I believe is the case here, is probably best suited for short-term investors only.
SPDV Analysis
Company Snapshot
The following table highlights selected fundamental metrics for 25 of SPDV’s holdings. I’ve chosen at least two representatives from each sector to provide the best representation possible. Furthermore, I’ve included summary metrics for EQL, SCHD, and SPY for comparison purposes.
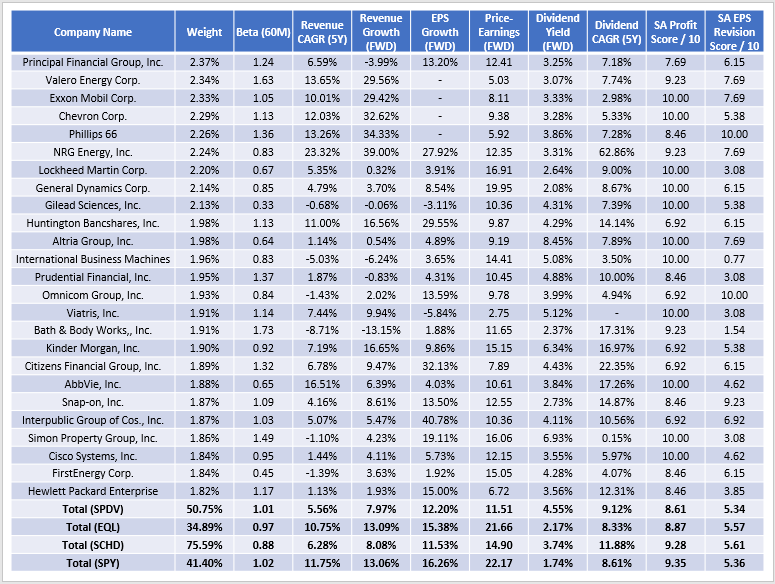
SPDV is considered a high-volatility ETF in the dividend space, and its current 1.01 five-year beta confirms this. I don’t think it will offer much downside protection compared to its peers, which usually feature betas below 0.90. SCHD is an excellent example at 0.88, whose drawdowns are generally much better. In Q1 2020, it outperformed by 11.39% and was up by about 4% YTD through September before this month’s relief. Plenty of other high-dividend funds have significantly outperformed all four of these ETFs this year, so it all comes down to how much protection you require.
High-dividend funds often come with significant sacrifices, the chief of which is slow growth. With SPDV, analysts expect 7.97% and 12.20% sales and earnings growth over the next twelve months, compared to 13.06% and 16.26% for SPY. These figures aren’t as bad as I expected. However, suppose you look at the individual stocks in the table above. You’ll see that most of the sales growth comes from the Energy sector, with the Financials sector providing much of the earnings growth due to higher interest rates. For reference, SPDV’s median sales and earnings growth rates are just 4.23% and 9.59%, so I believe it’s still a low-growth portfolio that will likely lag if the market rebounds.
Another sacrifice is profitability. I’ve normalized Seeking Alpha’s Quant Grades on a scale of 1-10 and calculated 8.61 for SPDV compared to 8.87, 9.28, and 9.35 for EQL, SCHD, and SPY. This score is relatively low for a large-cap fund and may put into question future dividend growth. Constituents have grown dividends by 9.12% over the last five years, but there are a few outliers like NRG Energy (NRG), whose 62.86% growth is unlikely to repeat. SCHD is still best in class at 11.88%, and its 3.74% gross dividend yield is still attractive.
On the positive side, SPDV trades at just 11.51x forward earnings, which is about as low as you can get in the large-cap dividend category. Only four stocks trade above 20x, and the fund’s valuation is almost half of EQL and SPY and a few points lower than SCHD. Again, the deep-value theme is evident, and investors should know this strategy requires a lot of patience. Unfortunately, SPDV doesn’t seem to have it, with portfolio turnover rates of 69% and 84% in the last two years. I understand that’s part of the deal, but SPDV looks to be chasing its tail too much, which could explain its poor performance. This portfolio looks excellent from a valuation perspective today, but many of these stocks could be sold too early when the Index reconstitutes in January. In the end, investors are only guaranteed a high dividend.
Q3 Earnings Season
In the earlier table, I included SPDV’s low 5.34 / 10 EPS Revision Score, which is common for equity ETFs nowadays. Market sentiment remains poor, and earnings surprises are trending downward or flat for most sectors. We’re about 20% through Q3 earnings season now, and 15 of SPDV’s constituents have reported results as follows:
- Walgreens Boots Alliance (WBA): 3.75% earnings beat
- Citigroup (C): 12.56% earnings beat
- Lockheed Martin (LMT): 2.32% earnings beat
- Omnicom Group (OMC): 3.70% earnings beat
- IBM (IBM): 0.70% earnings beat
- Kinder Morgan (KMI): 11.82% earnings miss
- Citizens Financial Group (CFG): 2.35% earnings beat
- Snap-on (SNA): 7.08% earnings beat
- AT&T (T): 10.42% earnings beat
- Philip Morris (PM): 12.56% earnings beat
- Dow (DOW): 3.44% earnings miss
- Whirlpool (WHR): 16.13% earnings miss
- Huntington Bancshares (HBAN): 2.74% earnings beat
- Interpublic Group (IPG): 7.12% earnings beat
- Verizon Communications (VZ): 2.49% earnings beat
Of course, context is essential, as this group’s average 2.43% earnings surprise doesn’t tell the whole story. According to Yardeni Research, aggregate S&P 500 earnings surprises were around 5-7% in the previous three quarters, so I think these preliminary results are mediocre. However, the average EPS Revision Score for these stocks improved to 5.79 compared to 5.54 at the end of September. In particular, Omnicom Group’s EPS Revision Grade went from C+ to A+ as analysts praised its 7.5% organic sales growth rate. The stock is up 11.24% in October, so perhaps this is the quarter where optimism resumes.
With that said, the next two weeks will likely result in higher-than-normal volatility, with 32 more companies scheduled to report. The below table summarizes sales and earnings expectations for the next 25, and I have highlighted a few I think are vulnerable.
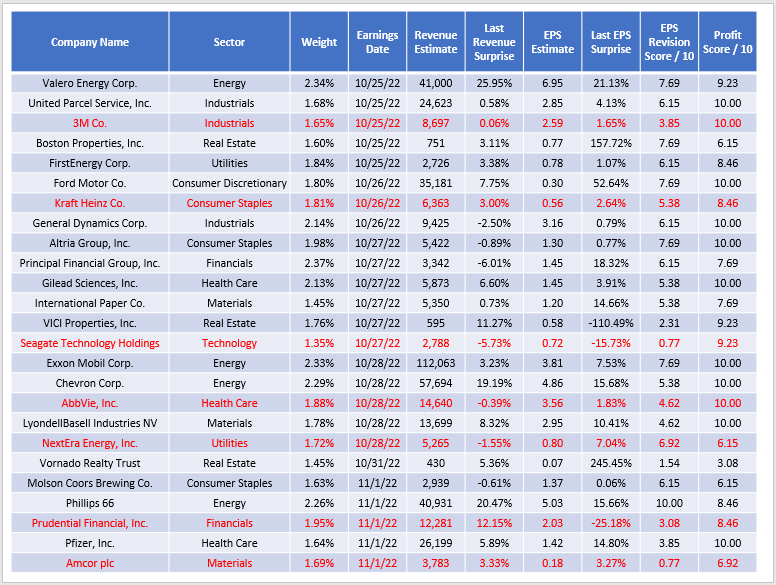
For example, 3M (MMM) is the subject of more than 230,000 lawsuits, which is a key reason its EPS Revision Grade is a paltry 3.85 / 10. Sales and earnings beats were just 0.06% and 1.65% in Q2, and the stock’s 5.10% yield hasn’t been enough to offset the 34% price plunge YTD.
Seagate Technology Holdings (STX) and its competitor, Western Digital (WDC), are nearly 50% this year, leading analysts to downgrade their price targets based on management’s guidance. STX, which SPDV holds, and WDC, have “F” Seeking Alpha Revision Grades, while memory chip manufacturer Micron Technologies (MU) announced plans to cut wafer fab spending by 50% next year. I believe these companies are playing defense and have incredibly high earnings risks. That makes SPDV a risky ETF to own over the next few weeks, contrary to high-dividend investors’ desires.
Investment Recommendation
SPDV combines free cash-flow yield and dividend yield screens to select five S&P 500 companies from each sector. The strategy considers relative value, ensuring low P/E sectors like Financials and Energy aren’t over-represented while still delivering a high dividend yield of around 4%. Income investors will also appreciate SPDV’s 11.51 forward price-earnings ratio, which is 50% cheaper than SPY and even a few points better than SCHD, a solid benchmark in the dividend ETF space.
I don’t mean to minimize these positives, but I think SPDV is too deep-value for my liking. Its 1.01 five-year beta and historical track record indicate it’s unlikely to offer much downside protection, which is unusual for a high-dividend ETF. Furthermore, most of its holdings are slow-growth names that face a precarious Q3 earnings season ahead. Therefore, I’m not yet comfortable recommending SPDV and will stay neutral for now.
Photo by Carlos Muza on Unsplash