Summary
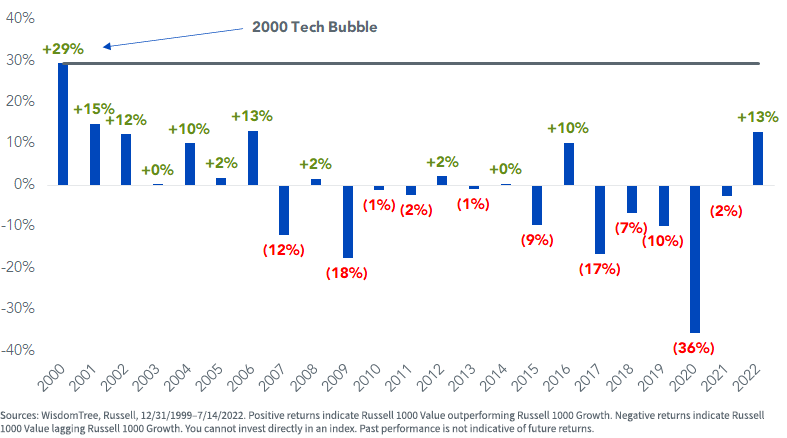
- After the bursting of the tech bubble in 2000, value went on a stretch of seven consecutive years of outperformance.
- Traditionally, investing via dividends is a more defensive approach to value – more over-weight in Consumer Staples and Utilities and less dependent on the more cyclical Financials sector.
- Most of the pain in U.S. equities this year has been felt by non-dividend payers relative to dividend payers.
If history is any guide, value’s new run may just be getting started.
After the bursting of the tech bubble in 2000, value went on a stretch of seven consecutive years of outperformance. That was followed by growth leadership for 11 of the last 15 years.
Through the first half of the year, value is on pace for its best performance relative to growth since before the Financial Crisis.
Russell 1000 Value vs. Russell 1000 Growth
Dividends as a measure of value—and specifically, high dividends—have had an even stronger six-month run.
Year-to-Date Index Performance
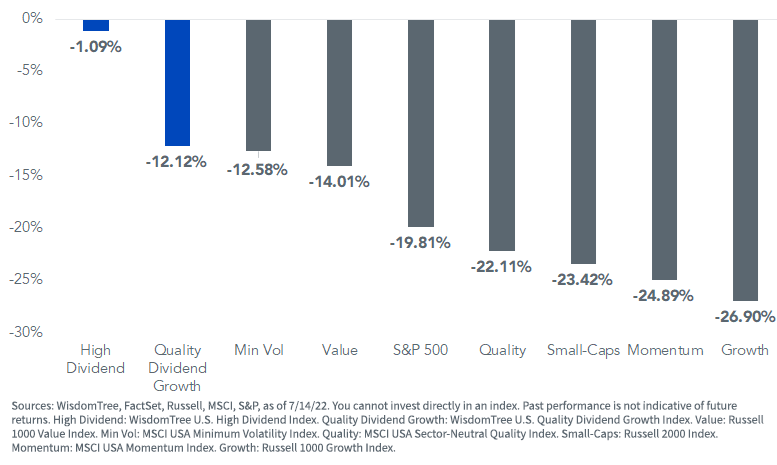
Traditionally, investing via dividends is a more defensive approach to value—more over-weight in Consumer Staples and Utilities and less dependent on the more cyclical Financials sector (which increasingly uses more discretionary share buybacks for payouts).
This year, high dividends have also had the tailwind of being over-weight in Energy, the only positive S&P 500 sector for the year.
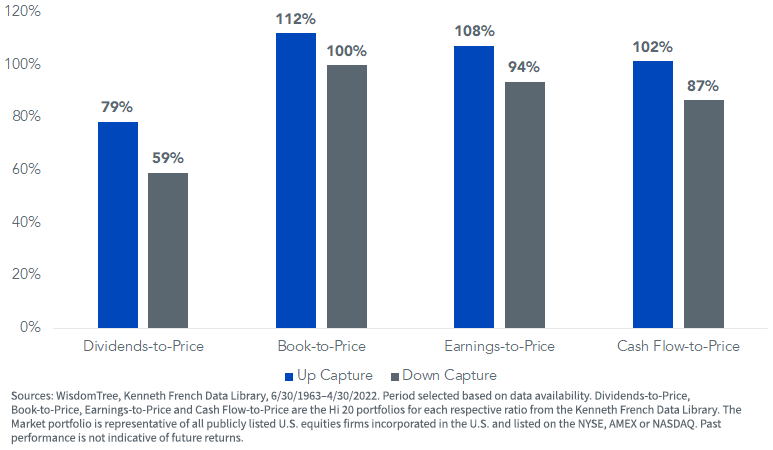
This “defensive value” nature of high dividends can be seen from the down-capture ratio of just 59% for a value portfolio sorted by dividend yield. A portfolio sorted on book-to-price (the most traditional academic measure of value) has a down-capture rate of 100%.
Value Portfolio Up/Down Capture vs. Market
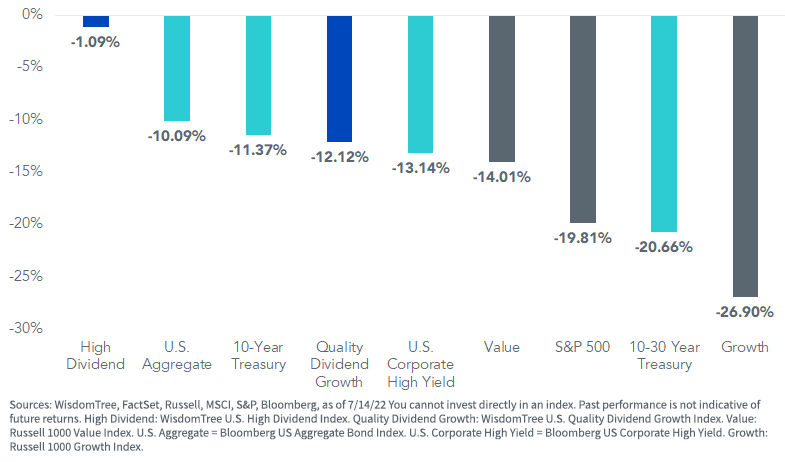
With volatility elevated, sluggish growth expectations and high inflation now entrenched in the collective psyche of investors, high dividends have been a haven not just compared to equities but fixed income as well.
As a result of this environment of seemingly nowhere to hide for asset allocators, high-dividend ETFs have taken in a record $25 billion in assets so far this year.
Year-to-Date Index Performance
Avoiding Value Traps
Using dividends as a measure of value has a key advantage over measures like earnings or book value in times of uncertainty – a dividend is an unambiguous measure of value that is insulated from aggressive accounting practices.
But some dividend payouts are less stable than others.
To account for the risk of investing in dividend payers that have deteriorating prospects of being able to maintain or grow their dividends, WisdomTree’s dividend Indexes have a composite risk screen to weed out potential value traps.
Companies that fall within the bottom decile of a composite risk score (CRS), which is composed of an equally weighted score of the below two factors, are not eligible for inclusion in our Indexes.
- Quality Factor – determined by static observations and trends of return on equity (ROE), return on assets (ROA), gross profits over assets and cash flows over assets. Scores are calculated within industry groups.
- Momentum Factor – determined by stocks’ risk-adjusted total returns over historical periods (6 and 12 months).
In addition to screening out the riskiest decile of companies based on the CRS, we have also included a screening of the highest-yielding companies (the top 5%) that also have below-average (bottom five deciles) risk scores. Prior to a dividend cut, market participants will typically price a dividend as unsustainable, causing share prices to drop and the yield to skyrocket.
Earlier this year, we highlighted the AT&T dividend cut as a live case study of the type of dividend cuts our risk screen was designed to avoid.
Conclusion
Most of the pain in U.S. equities this year has been felt by non-dividend payers relative to dividend payers. Going forward, should we see material weakness in the economy, investors may begin to focus on the safety of dividend payouts.
In this type of slow (or negative) growth backdrop, our composite risk screens are aimed to mitigate exposure to distressed companies with unsustainable dividend payouts.
photo by unsplash

