

Summary
- Dividend champions are companies that have raised the dividend for 25 years. These are coveted by DGI investors because of the dividend safety they represent.
- Finding companies with long dividend growth histories, high initial yields, and a quickly growing dividend is the trifecta of dividend growth investing.
- I present 5 companies that have higher starting yields and faster growth and cover the current valuation of each.
This is Part 1 of a 2 part series covering dividend champions offering higher starting yields and faster dividend growth. This article is a starting point for further research, not an in-depth analysis.
Dividend champions are companies that have raised their dividend for 25 consecutive years. At present, 143 companies meet this criterion. Achieving this feat isn’t easy because it requires a company to keep growing through various economic and competitive challenges.
Dividend growth investors covet these companies because they are so resilient. However, most companies on this list are growing slowly, which means the dividend is also growing slowly.
The trifecta of a dividend growth stock is a long dividend growth history, a high yield, and a high dividend growth rate.
- Dividend growth history – The ability to grow the dividend over a long period shows both a commitment to the dividend and an ability to continue to grow through challenging times. While a long growth history by itself is not a guarantee the company won’t cut the distribution, it is a likely indicator of dividend safety.
- Dividend yield – The starting yield on a dividend growth company is like an anchor. Dividend growth rates can slow over time, so there is more risk in accepting a low yield believing a high dividend growth rate will more than make up for it over time. Many DGI investors will have a minimum initial yield, such as 2.5% or 3%.
- Dividend growth rate – The rule of 72 is vital for DGI investors to know and apply. Simply put, 72 divided by the growth rate of anything will be the time it takes to double. So a company growing the dividend at 10% will take 7.2 years for the current dividend to double. For example, Philip Morris (PM) recently raised the dividend by 1.6%. At this rate, it will take 45 years for the distribution to double. Contrast this to Lowe’s (LOW), which raised the dividend by 31% this year. At this rate, Lowe’s will double the dividend in less than 2.5 years and surpass the PM yield in less than six years, even at a much lower starting yield. Every DGI investor should be aware of the expected dividend growth rate of the companies in their portfolio.
In the above example, it is improbable that Lowe’s will raise the dividend by 31% yearly, but we know today’s yield with absolute certainty. Unlike initial yield and years of dividend growth, which are hard facts, nobody knows what a company will do in the future. For this reason, most investors will emphasize the initial yield over growth. Because of this emphasis, it’s important to get the highest initial yield possible.
Many companies with very long dividend growth streaks will have slower dividend growth than younger companies. Often this occurs because these companies have run out of room to expand the payout ratio any further, so dividend growth can only match earnings growth. This is an important consideration with any dividend growth stock. Is the company growing the dividend out of earnings or by expanding the payout ratio? Companies expanding the payout ratio will eventually need to slow the dividend growth rate to match earnings growth.
I like to use historical yields versus today’s yield as a starting point to investigate possible bargains in the DGI universe. Below I review five dividend champions that offer higher starting yields and dividend growth rates near or above 7%, which is my target for dividend growth in my overall portfolio.
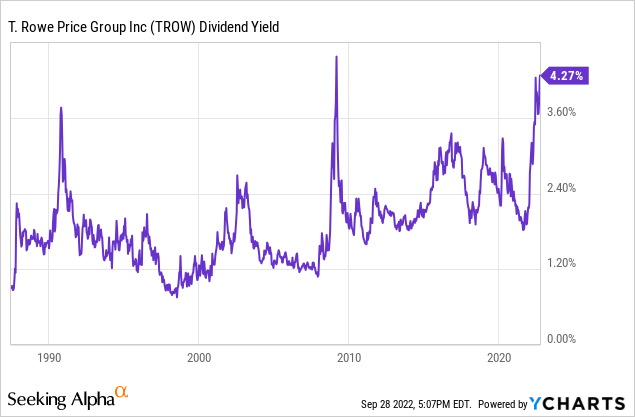
T. Rowe Price Group (TROW)
With 36 years of dividend increases, TROW increased its dividend through the dotcom crash and the GFC. Sure, today’s markets are different; however, its ability to increase through such difficult times in the market speaks loudly about its quality. As TROW makes more money when the market is high, it is doubtful that next year’s earnings forecasts have fully accounted for a potential recession and corresponding market drop.
TROW has a 3-year dividend growth rate above 15% and a 10-year growth rate of over 13%, bucking the trend of slowing dividend growth over time. Additionally, the company pays special dividends every few years, the last of which was $3.00 per share in 2021.
Historically, payout ratios for TROW have been in the upper 30% range. This ratio spiked during the GFC to 60%, still offering a margin of safety. The current earnings projections for the next couple of years indicate a similar jump in payout ratio, but as I stated, these will likely come down further if the market drops to reflect a full-blown recession.
As shown in the chart below, the current yield of 4.5% was only topped during the GFC. Investors who bought at that point in 2009 are up fivefold and enjoying a yield on cost pushing 25%. The risk-reward on TROW is highly in favor of the investor buying today.
Medtronic (MDT)
Few companies are as beaten up as Medtronic. The company is trading near the highest yield it has offered in its very long history at 3.3%. The blue line on the Fastgraph below shows that over the past twenty years, MDT has an average P/E of 20, significantly higher than today’s 15. The next couple of years have muted earnings forecasts; the five-year growth estimates are 8-12% annually, for what they are worth.
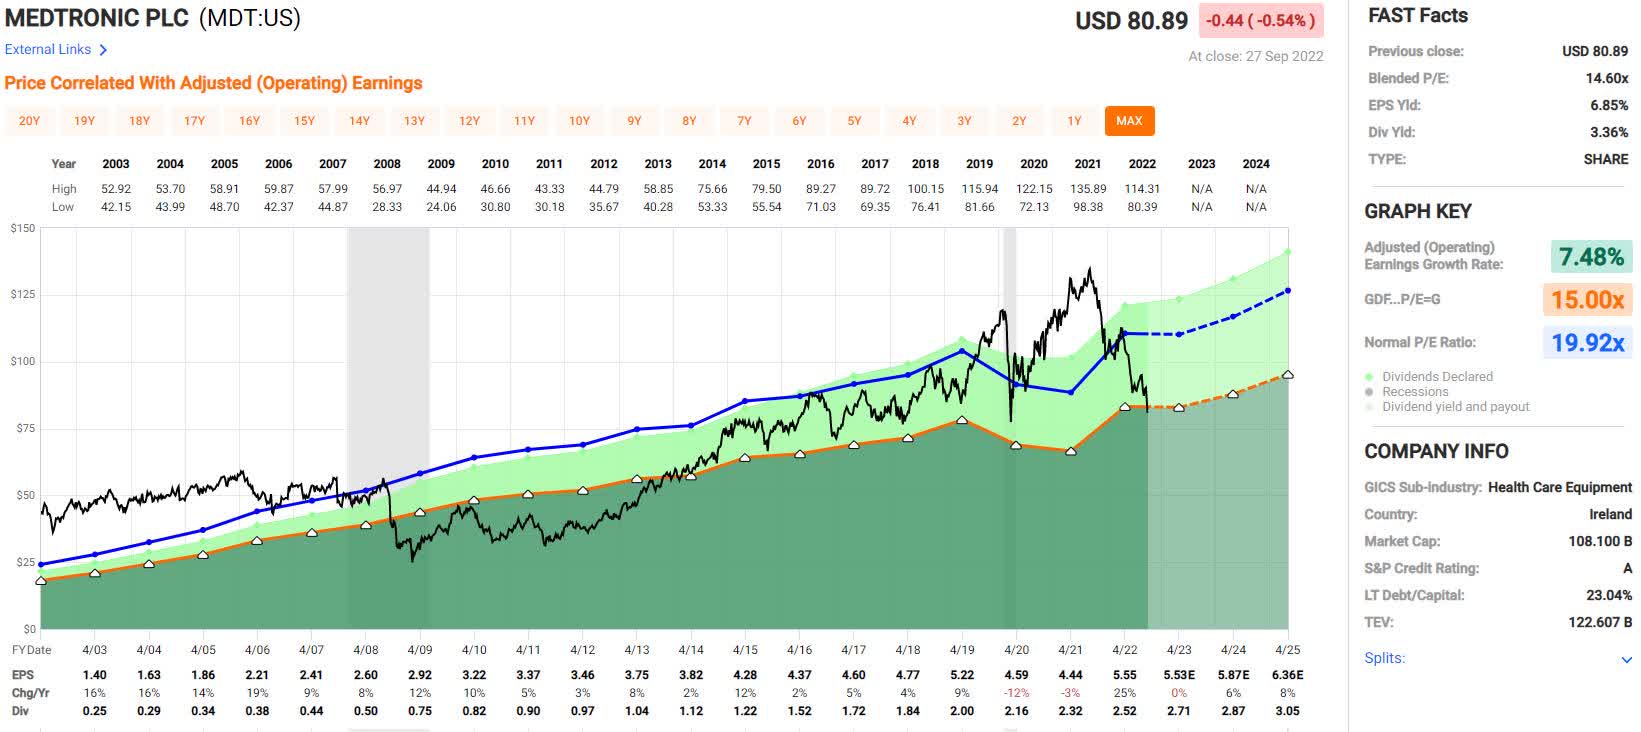
This dividend champion has 45 years of dividend growth. More importantly, even with such a long streak, the company has a 10-year growth rate of 10%, and 3 and 5-year growth rates of 8%. The most recent raise was right in line at just under 8%. Given the likely growth of the company, this rate looks sustainable in the future.
Medtronic’s payout ratio has increased steadily over the past twenty years to stand at close to 50% today. This ratio is higher than other medical device makers, which tend to be closer to 30%. This indicates that Medtronic’s dividend growth will most likely need to match earnings growth in the future.
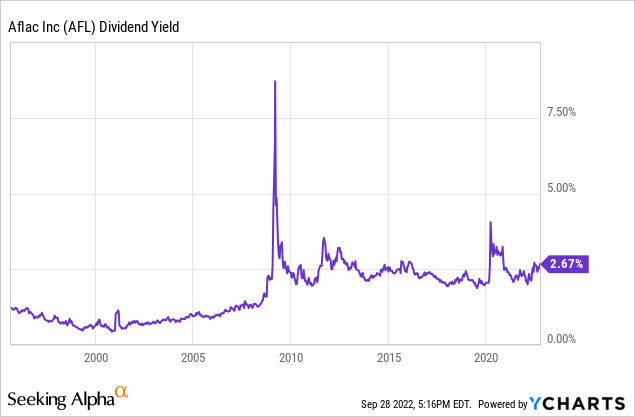
Aflac (AFL)
With a 40-year dividend growth streak, Aflac is one of several insurance companies on the dividend champions list. Unlike the rest, Aflac pays a decent starting yield of 2.8%, and maintains a solid dividend growth rate. The last two increases have been a whopping 21 and 18%! The company has a ten-year dividend growth rate of 8%.
Over the last decade, Aflac has maintained a payout ratio in the low to mid-20% range. They keep this payout consistent by matching dividend increases to earnings. This consistency does have one side effect for dividend growth investors. Unlike Medtronic or Johnson & Johnson (JNJ), where dividend growth is highly consistent, Aflac’s raises are very lumpy. Some years you get tiny raises, and massive raises can follow these up. An investor needs to be in it for the long haul to see the 10-year average dividend growth of 8%.
The current yield of 2.8% is not particularly attractive in a recent historical context. The table below shows that the current yield has been matched several times over the past decade.

If we take a longer view of the company, we can see that the yields since the GFC have been historically higher than before. This is shown in the graph below. Note that the yield on Aflac topped 4% during the flash crash, and during the GFC, it was priced to fail at nearly 9%. If the market begins pricing in a recession, Aflac may offer a significant bargain.
Air Products and Chemicals, Inc. (APD)
There are several chemical manufacturers on the dividend champions list. Chemicals are one of the safest dividend industries, as it had the highest percentage of surviving dividend streaks during the GFC. While a few of these companies grow the dividend at a decent rate, Air Products and Chemicals is currently the only chemical company offering close to a 3% starting yield.
Even after 40 years of dividend growth, APD continues to grow the dividend at a rapid clip. The 5- and 10-year growth rates are both over 10%. We find some interesting information when we dig into the payout ratios of how this dividend growth is achieved.
The chart below shows the payout ratio from adjusted earnings. Ordinarily, I like to work with adjusted earnings and cash flow payout ratios.
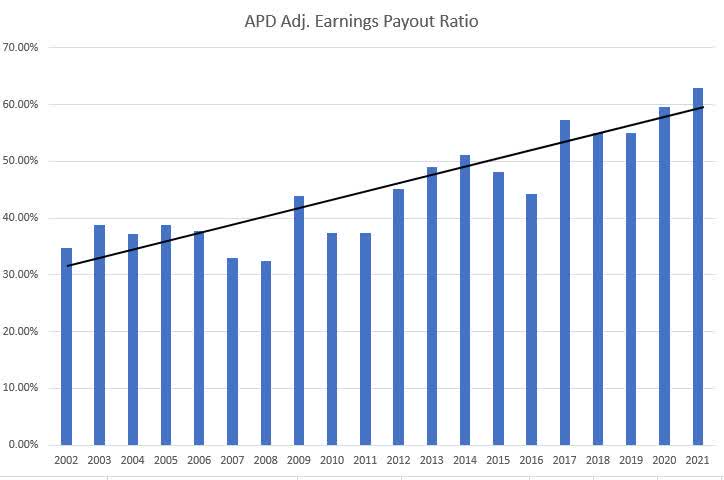
This chart shows a steady increase in the payout ratio. On the surface, this indicates that APD may have trouble increasing the dividend in the future if earnings don’t keep up. Additionally, the current payout ratio, at 60%, stands higher than other chemical companies on the dividend champions list. However, when we examine other factors, this expansion of the adjusted earnings payout ratio does not appear to be as much of a concern.
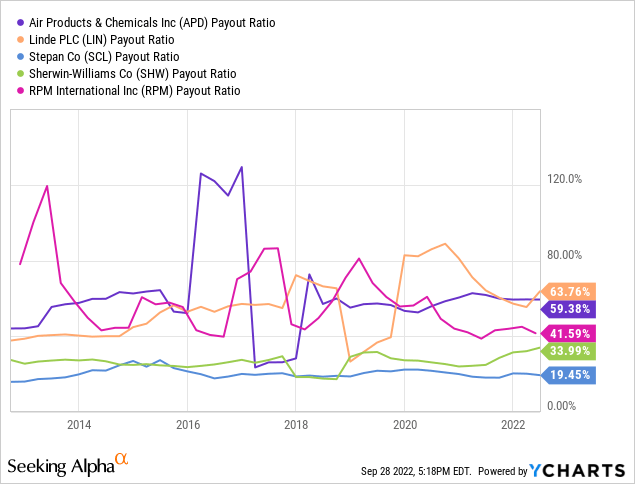
The operating cash flow payout ratio of APD has been flat for many years. This is a promising indicator, as dividends are paid out of cash flow at the end of the day. Additionally, looking at the basic earnings payout ratio against its peers, we notice that it is on the higher side. However, we can also see that it is relatively flat. This is shown in the chart below, with selected dividend champion chemical companies.
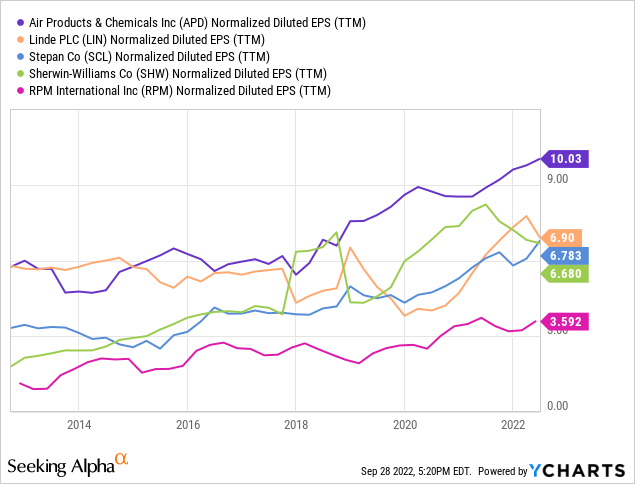
Finally, when we look at the EPS history of APD and its peers, we see that APD has grown favorably. The overall slope of the line represents the rate of change in EPS for the companies. As a whole, APD requires more research to be comfortable with the sustainability of the dividend growth rates.
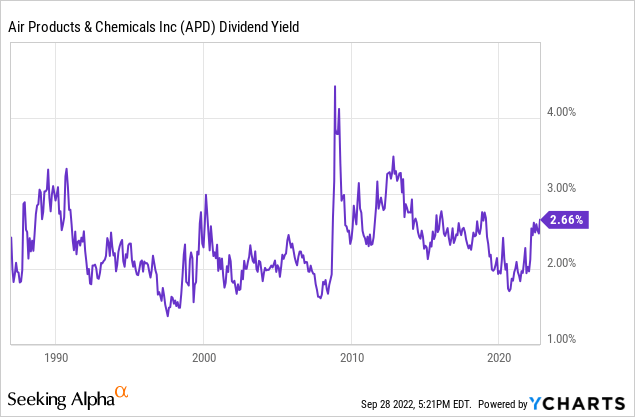
The price of APD has fallen significantly from its high. However, the current yield of 2.8% is unremarkable for the company. This is shown in the yield graph below. Instead, we see that the company was offering a historically low yield over the past few years. This low yield corresponded with extreme overvaluation in the company (and most chemical companies as well.)
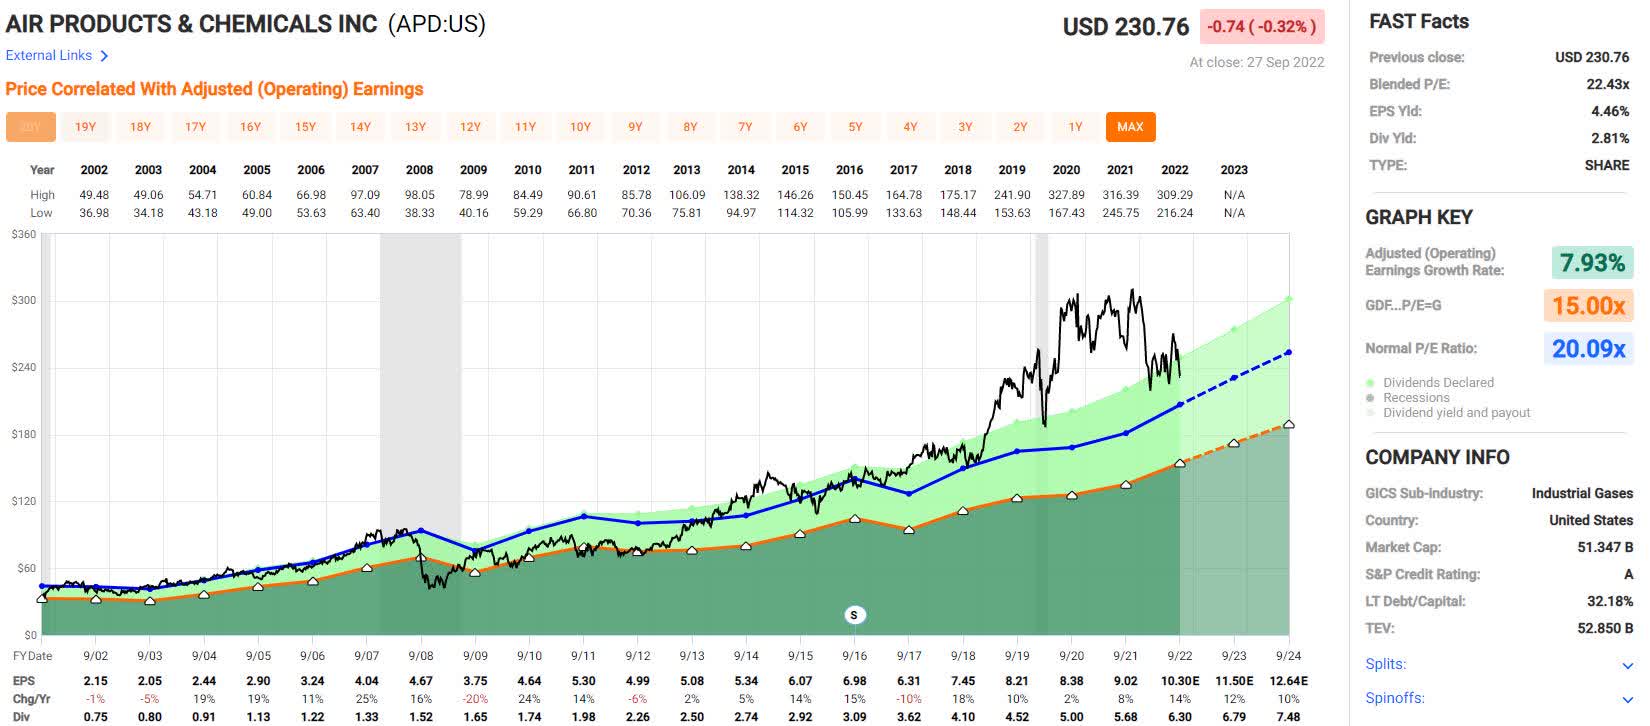
The Fastgraph below shows that the average P/E, represented by the blue line, for APD is at 22, similar to where it stands today. Going into the flash crash, the P/E was nearly 30, and the price has yet to reach anywhere near a historical bargain. During the GFC, the P/E fell all the way to 11. Given the other options in the market, APD is far from approaching a bargain entry point.
Enbridge (ENB)
Enbridge is a bit of an anomaly on the dividend champions list as a Canadian company. This is because, along with the challenge of simply increasing the dividend every year, they also fight exchange rate fluctuations. The dividend champions list is maintained in terms of US$. In effect, this means that in years the Canadian dollar is strong, Enbridge pays out a higher US$ dividend; in years it is weak, the payout drops in US dollars. It will be interesting to see if the company can stay on the list with the Canadian dollar at multi-decade lows.
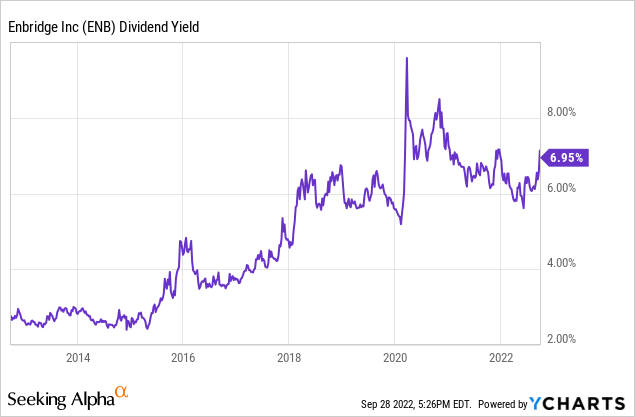
Currency fluctuations aside, the company has raised the dividend for 26 years at an impressive clip. In addition to being the highest-yielding company on this list, DGI and high-yield investors alike should consider this company because of its dividend growth. The company currently yields 7.1%, with 3-, 5-, and 10-year dividend growth rates of around 10%. However, the most recent increase was well below this at only 3.5%.
The company pays out in the mid-60% range of its operating cash flow as dividends. This ratio compares reasonably with other pipeline companies. As the payout ratio has grown rapidly over the past decade, it is unlikely that the company will see continued fast growth. However, US investors today could see accelerated income growth if the Canadian dollar rebounds. Currency fluctuations are one of the reasons I shy away from foreign companies, as it’s just one more variable.
I don’t consider Enbridge a particularly great bargain today, although it’s not overpriced either. The chart below shows that the current yield of 7.1% is similar to where it has been since 2018.
Next Up in Part 2
I hope you found this overview useful. This review is meant to be a jumping-off point for further research, not an in-depth analysis. In Part 2, I will cover six additional champions offering reasonable yields and faster growth.
Photo by Giorgio Trovato on Unsplash