

Summary
- It’s been a difficult year for many an investor. Equity REITs and mortgage REITs have been pummeled especially hard.
- Many high-single-digit yielders may be in permanent decline, as their dividend payout is actually greater than their total return, eroding the companies’ equity market value.
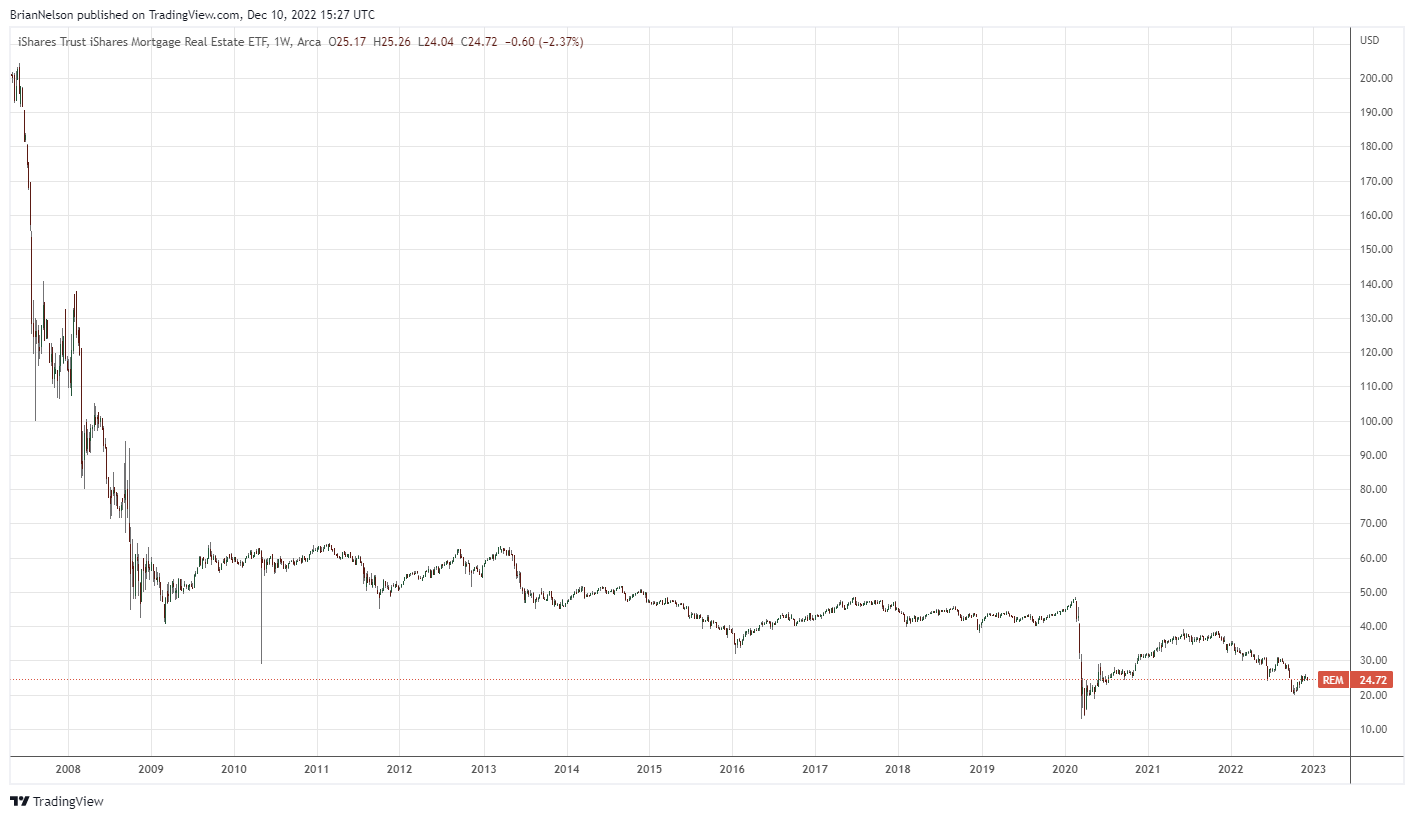
- A visual of the mortgage REIT ETF is informative as to how paying too high of a dividend yield erodes capital appreciation (and capital) over time.
- Remember: A dividend is capital appreciation that would have been achieved had the dividend not been paid. Dividend investors are getting paid with their own money because, as equity owners, they already own the cash on the company’s balance sheet before the dividend is paid.
- Let’s dig into these three companies that have relatively resilient Dividend Cushion ratios and pay a comparatively strong dividend yield.
By Valuentum Analysts
It’s been a difficult year for many an investor. Equity REITs and mortgage REITs have been pummeled especially hard, and they haven’t contributed much during the past five years either, and perhaps many mortgage REITs may never return to their glory days. The iShares Mortgage Real Estate Capped ETF (REM
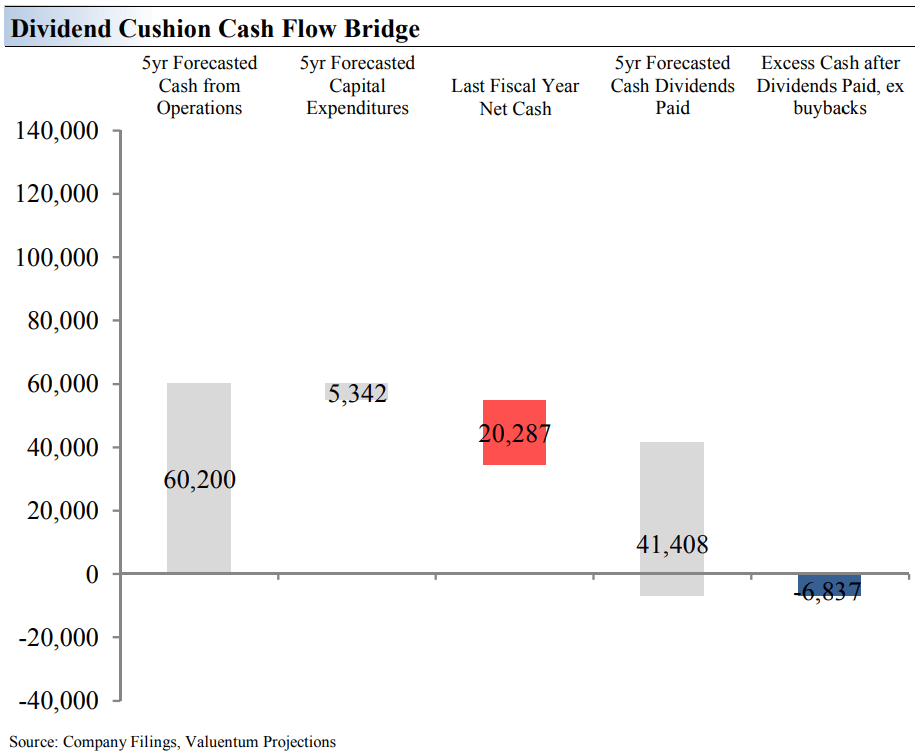
That said, we’re not so much against the concept of investing in dividend yielders of 3-4% as we are about business models that we think are hugely vulnerable as it relates to dividend health. But what is a vulnerable business model when it comes to dividend payers? Well, it is one that is largely capital market dependent in that the business needs constant new capital from the markets to pay not only its distribution but also investment needs. Many of these companies include master limited partnerships, equity REITs and mortgage REITs, among others. If an entity’s free cash flow, as defined by cash flow from operations less all capital spending, is less than the cash dividends it pays, it must get the difference from somewhere – and you guessed it, that capital must come from the capital markets through new debt or equity issuance.
Again, please don’t mistake what we’re saying about a 3-4% yield potentially being too small to believe that we like high-yielders two to three times that level. Quite the contrary. Many of those high-single-digit yielders (8%, 9%, 10% and above) may be in permanent capital decline as interest rates increase because their dividend payout is actually greater than their total return, which erodes the company’s equity market value. A visual of the mortgage REIT ETF is informative as to how paying too high of a dividend yield erodes capital appreciation (and capital) over time. Remember: A dividend is capital appreciation that would have been achieved had the dividend not been paid. Dividend investors are getting paid with their own money because, as equity owners, they already own the cash on the company’s balance sheet before the dividend is paid.
With all of this said, we think the sweet spot of high-yield dividend investing falls somewhere in the 4-6% dividend yield range, at least at the moment. For one, investors can still find equities in this area that may not be completely capital-market dependent. Some may have a large net debt position that weighs on their intrinsic value estimate, but they aren’t dependent on the healthy functioning of the capital markets to keep dividends flowing and investments moving along, per se. Many times stocks have high dividend yields simply because their debt positions often are a huge part of their capital stacks.
Second, a 4-6% dividend yield is still north of that on prevailing CDs that one can lock in over the next year or so at the local bank. It wasn’t but last year that CDs were yielding close to nil, but that is no longer the case with the Fed raising rates to combat inflationary pressures. Valuentum’s High Yield Dividend Newsletter portfolio that we provide to members of our service operates in this sweet 4-6% dividend yield range. Not too low as the dividend yield can be easily replaced by CDs, and not too high as to erode investor capital (again see above with mortgage REITs about what can happen to your capital if the dividend yield is just too high, where capital is in constant decline).
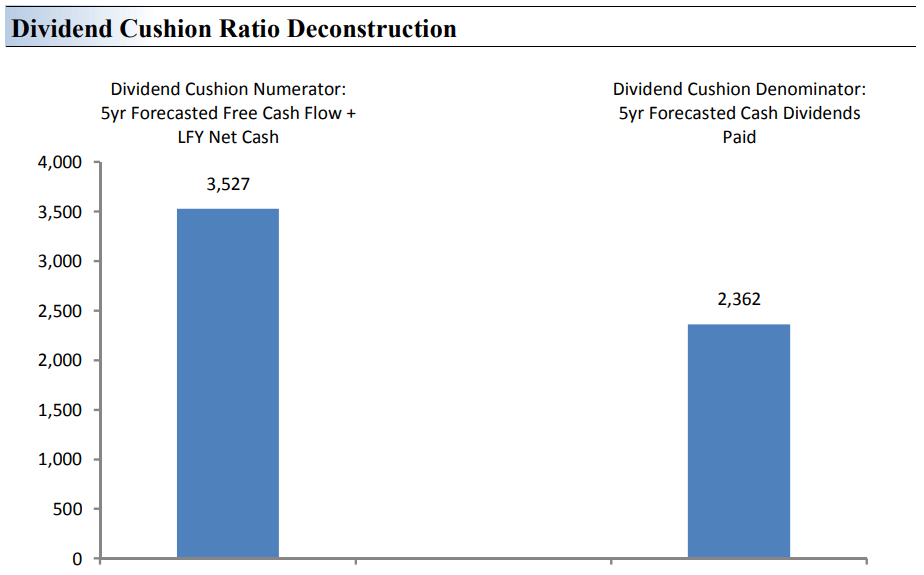
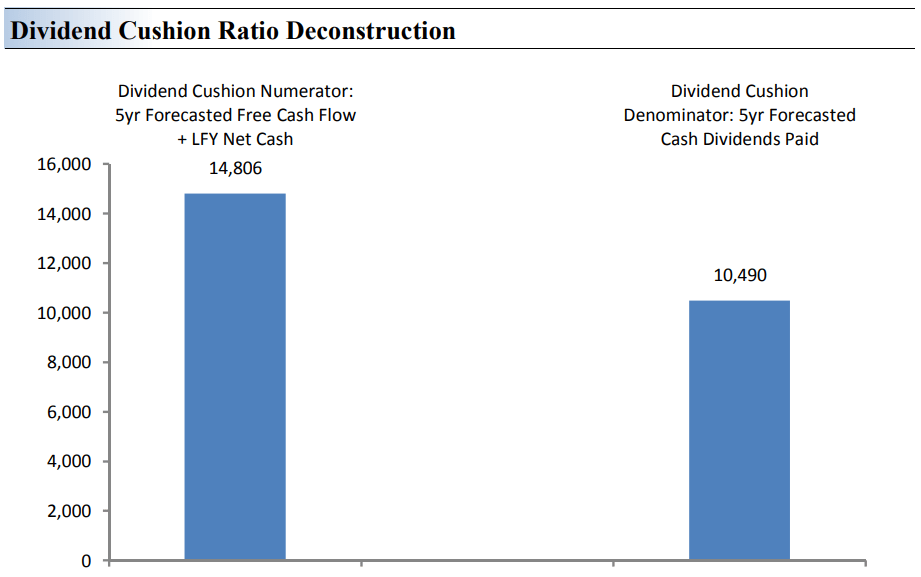
We also like to look at dividend-paying equities through the lens of what we call the Dividend Cushion ratio. At its core, the Dividend Cushion ratio is designed to provide the dividend growth investor, income investor, and high-yield investor with a forward-looking, free-cash-flow based opinion of the strength and future growth potential of a company’s dividend. The ratio not only highlights risks associated with potential dividend cuts, but the ‘cushion’ behind the Dividend Cushion reveals just how much capacity a firm has to continue growing its dividend in the future, above and beyond existing expectations.
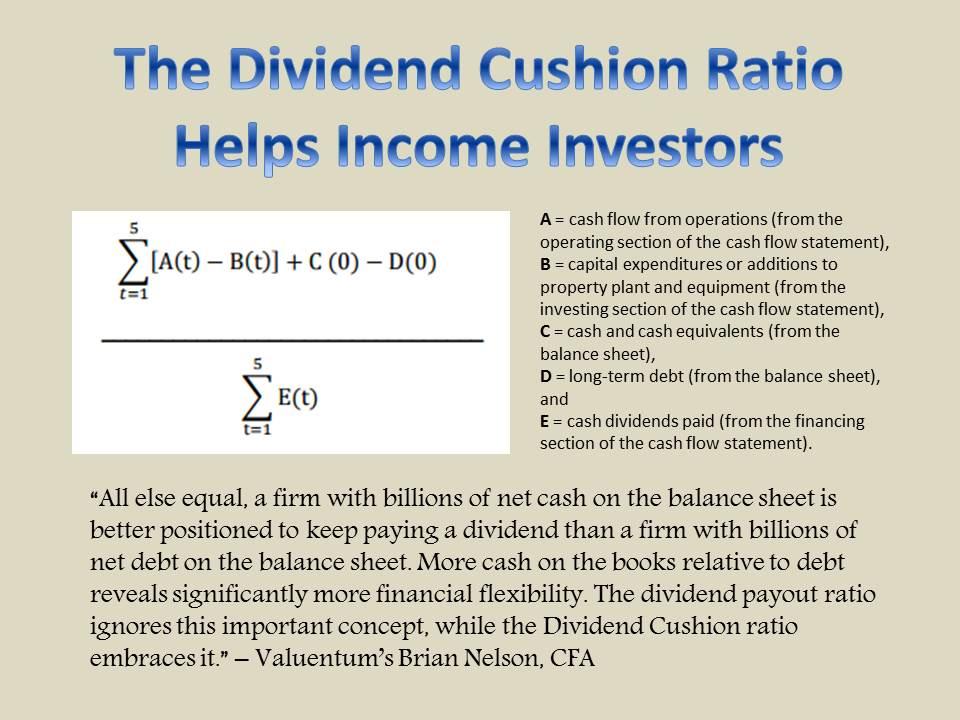
The foundation behind the measure – assessing future free cash flows relative to future cash dividend payments in the context of a company’s balance sheet – remains as relevant as ever. For example, Lumen Technologies (LUMN) announced November 2 that it would eliminate its payout. The interesting thing about Lumen Technologies was that it had a strong dividend payout ratio and free cash flow coverage of the dividend, but what it did not have was a strong net cash on the balance sheet.
In fact, it had a huge net debt position, and management cut the dividend. Where other dividend metrics failed to identify the risks of the payout, the Dividend Cushion ratio passed with flying colors. We calculate the Dividend Cushion ratio for each company in which we build a dividend report on our website. Without further delay, let’s dig into three names that have relatively resilient Dividend Cushion ratios and pay a comparatively strong dividend yield.
Whirlpool (WHR) – 4.9% Forward Estimated Dividend Yield
Whirlpool’s brand recognition has been a source of strength for some time and gives it material pricing power. This pricing power allows the company to preserve its margin performance in the face of serious inflationary headwinds seen of late. Whirlpool is targeting a dividend that is ~30% of normalized earnings on a trailing 12-month basis. The company is a Dividend Aristocrat and has increased its dividend over the past ~75 consecutive years. Ongoing cost productivity programs coupled with revenue growth is expected to drive future free cash flow generation and dividend growth. We expect Whirlpool to continue growing its payout at a decent pace going forward.
Whirlpool has a solid Dividend Cushion ratio, though its share repurchase program and potential M&A activity will compete for capital against its dividend program. Margin pressures from tariffs, raw material inflation, wage/labor expenses, and higher freight costs should be watched as it relates to the health of the payout. Whirlpool aims to convert ~7-8% of its net revenues into free cash flow over the long haul. However, in our view, Whirlpool’s long-term guidance appears to be a tad overly optimistic given the various inflationary headwinds, supply chain hurdles, and rising competitive pressures facing the company’s business. Here’s how we derive its 1.5 Dividend Cushion ratio, in any case.
Philip Morris (PM) – 5.0% Forward Estimated Dividend Yield
Philip Morris boasts some of the most recognizable tobacco brands in the world including Marlboro, L&M, and Chesterfield. It sells its cigarettes outside of the US market. Such brand strength gives it considerable pricing power, helping offset secular declines in shipment volumes of traditional tobacco products. Alternative tobacco products, such as its IQOS heated tobacco unit offering, have experienced strong demand growth over the past few years with room to run, supporting its growth outlook. Philip Morris expects to realize ~$2.0 billion in annualized cost savings by 2023 using 2020 levels as a baseline. It aims to pay out ~75% of its adjusted diluted EPS as dividends.
The biggest factors currently weighing on Philip Morris’ Dividend Cushion ratio are its large net debt position, and its massive annual dividend obligations. We assign the firm a “GOOD” Dividend Safety rating due to its brand recognition and strong free cash flow generating ability, but we warn investors that should its cash flows falter for any reason, this rating could be in jeopardy. Philip Morris launched a share buyback program in 2021, which will compete for capital against its dividend program. We do not expect the company to alienate its income-minded investors in the foreseeable future and appreciate Philip Morris’ ‘A-rated’ investment grade credit rating (A2/A/A). Philip Morris’ Dividend Cushion ratio is 0.8, which is okay.
Newmont Mining (NEM) – 4.7% Forward Estimated Dividend Yield
Newmont’s merger with Goldcorp has facilitated material pre-tax run rate synergies, much higher than its original estimates. Additionally, Newmont’s Nevada JV with Barrick Gold may generate additional upside (the JV was established back in 2019). Newmont paid out a special dividend of $0.88 per share in 2019 and its core quarterly dividend has grown at a healthy clip since then. Newmont’s balance sheet strength has improved materially in recent years as management has allowed cash to build up on the company’s balance sheet, aided by Newmont’s impressive free cash flow generating abilities.
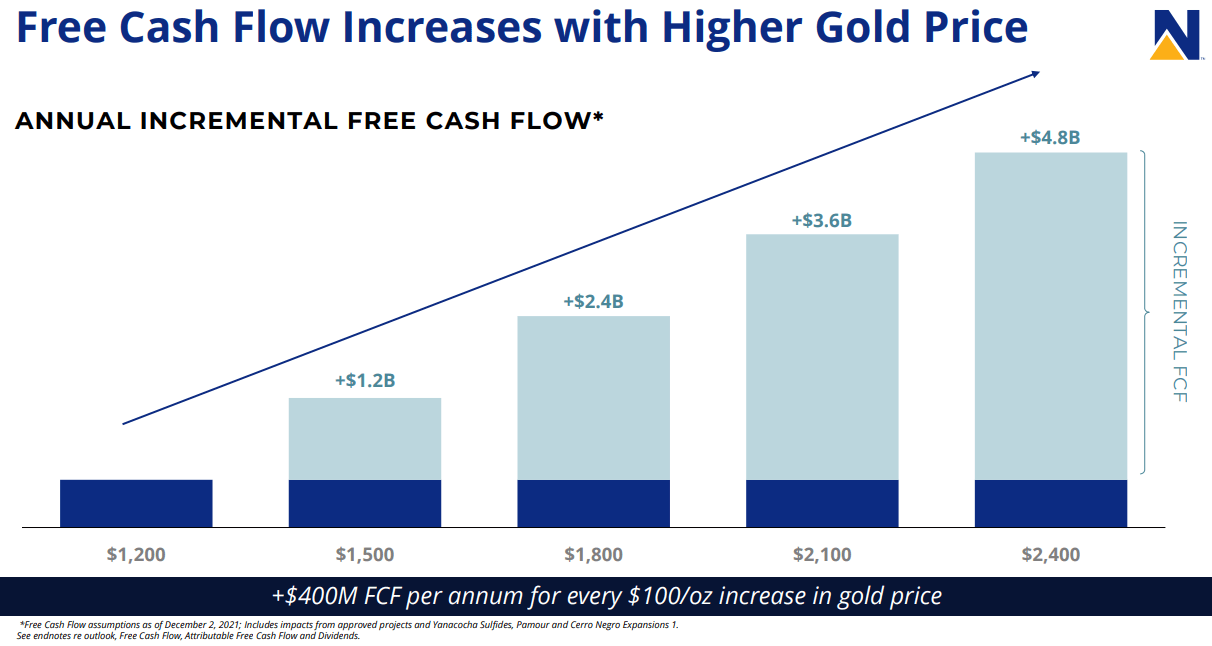
Newmont boasts a solid investment-grade credit rating, and while the near term has been tough for shares, it offers a unique dividend policy that embraces a base annualized dividend of $1.00 per share, payable at $1,200/oz gold price, with an incremental dividend payment targeting 40%-60% of incremental attributable free cash flow above the base gold price assumption. Newmont took advantage of strong gold prices seen in recent years to restore its balance sheet strength, though the firm’s total debt load is still quite sizable.
At the end of September 2022, Newmont had a net debt-to-adjusted EBITDA ratio of ~0.5x. Its dividend obligations have become significantly larger since 2019 in the wake of numerous payout increases, though its impressive free cash flow generating abilities and relatively modest net debt load underpins its stellar Dividend Cushion ratio. Newmont is exposed to fluctuations in gold prices and operational execution is key. However, there is not much that could stop the firm from growing its dividend going forward, in our view, assuming gold prices cooperate (of course).
Concluding Thoughts
High yield dividend investing isn’t as easy as picking the highest dividend yield one can find and evaluating the parameters of what may think is a good company without paying attention to other dynamics at play. For example, there are financial considerations at work where a company’s dividend yield could overwhelm capital (appreciation) creating a situation where a company’s equity could be in permanent decline or becomes permanently depressed.
Remember: A dividend is capital appreciation that otherwise would have been achieved had the dividend not been paid. As a business owner (stock investor), you already own that dividend in the form of cash on the balance sheet before its paid. Be careful getting lured into an idea just because of its dividend yield. Equities are priced as a function of the net cash position on their balance sheet and future expected free cash flows, not on the dividend payment (which is a subset, in most cases, of future free cash flows).
In this note, we highlighted three ideas that have relatively strong Dividend Cushion ratios and comparatively high dividend yields. Whirlpool may suffer in the coming recession, Philip Morris could face pressure as cigarette smoking growth wanes, and Newmont Mining’s dividend is exposed to volatile gold prices, but without such risks, these entities wouldn’t have such high yields in the first place. With these key risks clearly noted, these three ideas may be worth a look, offering readers what we believe is a neutral, if not, positive risk-reward consideration.
Photo by Youssef Abdelwahab on Unsplash