
Summary
- The SPDR Portfolio S&P 500 High Dividend ETF is composed of 80 companies that in aggregate have a 30-day SEC yield of 4.6%.
- To achieve that level of income, the fund is currently overweight the financial, utility, REIT, and energy sectors.
- Meantime, the P/E of the fund is 10.8x and the price-to-book is 1.6x – both of which are significantly below the valuation level of the S&P 500 (
. - Today, I’ll take a close look at the SPYD ETF to see if it might be attractive for investors seeking income and value.
As you no doubt already know, the 2022 bear-market has been distinguished by a large shift in investor sentiment away from high-valued growth stocks and into more value oriented and dividend paying companies. That being the case, investors are looking for income from their investments – and that is exactly what the SPDR Portfolio S&P 500 High Dividend ETF (NYSEARCA:SPYD
Investment Thesis
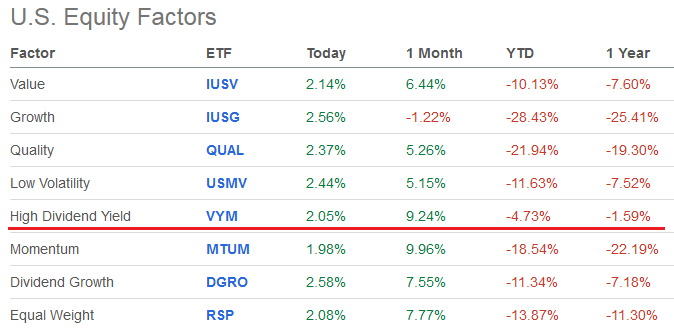
As the Federal Reserve has raised interest rates in order to combat inflation, the market has pivoted away from growth to value & income. Indeed, over the past year, the “High Dividend Yield” group has outperformed all other “equity factors” and beaten “Growth” by 23%+:
So, today I’ll take a closer look at a diversified ETF approach to allocating capital to the high dividend yield space. Specifically, the SPYD ETF. You can find additional information on the State Street Global Advisors’ SPYD homepage.
Top-10 Holdings
The top-10 holdings in the SPYD ETF are shown below and equate to what I consider to be a well-diversified portfolio across 80 companies:
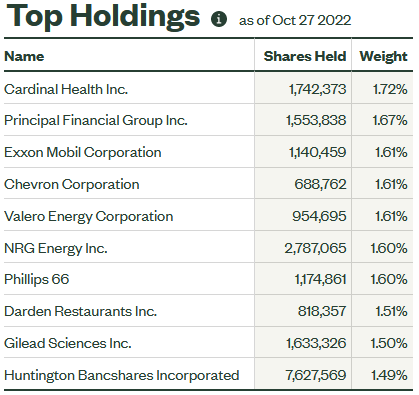
The #1 holding with a 1.7% weight is Cardinal Health (CAH
Holdings #3-#7 are all energy companies – led by Exxon Mobil (XOM
Chevron (CVX
The #7 holding with a 1.6% weight is Phillips 66 (PSX
The top-10 holdings are rounded out by #10 Huntington Bancshares (HBAN
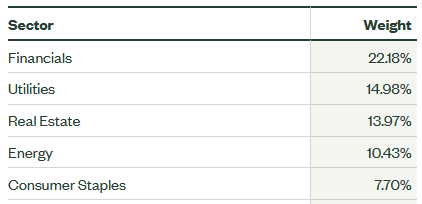
Generally speaking, the overall SPYD portfolio is significantly over-weight the following sectors:
For instance, the SPDR Financial Sector ETF (XLF
Valuation
As mentioned earlier, the SPYD ETF trades at a significant valuation discount to the S&P500:
| SPYD ETF | S&P500 | |
| P/E Ratio | 10.8x | 20.3x |
| Price-to-Book | 1.6x | 3.9x |
That being the case, investors should definitely consider that the SPYD not only provides strong income, but it is also very conservatively positioned in terms of valuation risk.
Performance
The SPYD ETF has an noticeably tepid performance track-record: the average NAV 5-year annual return is only 4.7%:
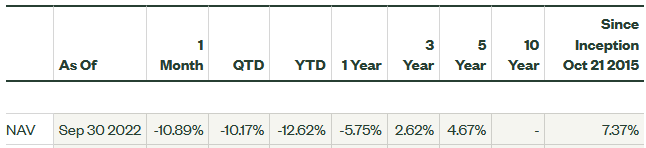
However, note that during most of the past 5-years encapsulated a low interest rate market that greatly favored growth over value and/or income. That is, SPYD’s returns as shown above are likely not indicative of “full-cycle” market returns or what to expect over the near- and mid-term during which interest rates will quite likely be considerably higher as compared to the last 5-years.
The following graphic shows the 5-year total returns of the SPYD ETF versus several of its peers, including: the Vanguard High Dividend Yield ETF (VYM
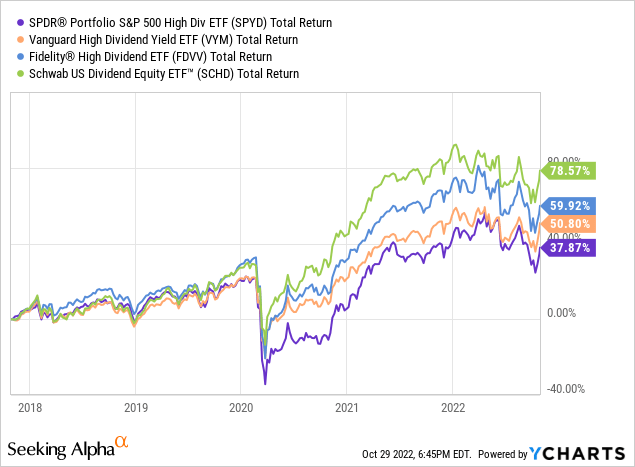
As can be seen, the SPYD ETF is the worst performing fund of the chosen group and has severely lagged my favorite dividend fund, SCHD, by a whopping 40%+. Note SCHD also has a lower expense ratio (0.06% versus SPYD’s 0.07%). While SCHD’s current 30-day yield of 3.49% is significantly lower than SPYD’s 4.59%, it is clear that from a total returns perspective, SCHD is the superior investment.
Risks
As just shown, the biggest risk of investing in the SPYD ETF might be a lack of total returns. That said, and while I do favor the SCHD ETF, note that it trades at a significantly higher valuation level as compared to SPYD: SCHD has a P/E ratio of 13.4x and a price-to-book of 3.2x (double the price-to-book of SPYD). From that perspective, if we continue to struggle in a weak overall market (excepting the big rally last week …), I would think the SPYD ETF has significantly less downside risk as compared to SCHD.
The other risk is that SPYD might represent a conglomeration of “value trap” type stocks – stocks that pay out a lot of cash-flow as dividends instead of investing for the future.
Summary & Conclusions
A well diversified portfolio should certainly have some investments for income. For me personally, I get the majority of my dividend income from individual energy stocks (indeed, I own three of the energy companies in the SPYD’s top-10 holdings), the SCHD ETF, and through shares of Broadcom (AVGO
Photo by Tyler Prahm on Unsplash