
Summary
- The 10y-3mo curve is likely to invert in September, virtually guaranteeing a recession.
- The reading on core CPI for July is expected to exceed the print for June.
- The Fed to double the QT in September.
- The Phase 2 selloff of the full bear market is approaching.
The three Phases of the Bear Market
I have been publicly bearish on SPDR S&P 500 Trust ETF (NYSEARCA:SPY) since March 25th with this simple bearish thesis: the Fed’s expected monetary policy tightening cycle will cause a recession, and a recessionary bear market in stocks.
However, based on my research, the recessionary Fed-induced bear marker has three phases:
- The Phase 1: The Liquidity shock. Historically, as the expectations of monetary policy tightening increase, stock market initially sells off with the busting of all speculative bubbles. This is the pre-recession phase.
- The Phase 2: The Recession selloff. The monetary policy tightening eventually causes the increase in unemployment and a recession. As a result, the corporate earnings decrease, which causes the Phase 2 selloff of the full bear market.
- The Phase 3: The Credit shock selloff. The deep recessions, such as the 2008 recession, cause the increase in the credit spreads to high levels, followed by corporate bankruptcies, and forced selling or broad deleveraging. This is the most painful stage of the full bear market – the Lehman Brothers stage.
But, what happens in between these bear market stages? The bear market rallies! In fact, I recommended taking profits on short S&P500 positions on May 3rd, as the Liquidity risk eased.
Furthermore, I had the courage to recommend buying stocks expecting the summer rally in stocks on May 30th.
The summer rally
I expected the summer rally mainly due to these two variables:
- As previously explained, the peak in Fed hawkishness caused the peak in the Liquidity risk selloff, or the completion of the Phase 1 of the full bear market.
- However, the probability of an imminent recession was still very low, which I expected would delay the Phase 2 selloff. Thus, I expected that less selling and short covering would cause a significant summer rally.
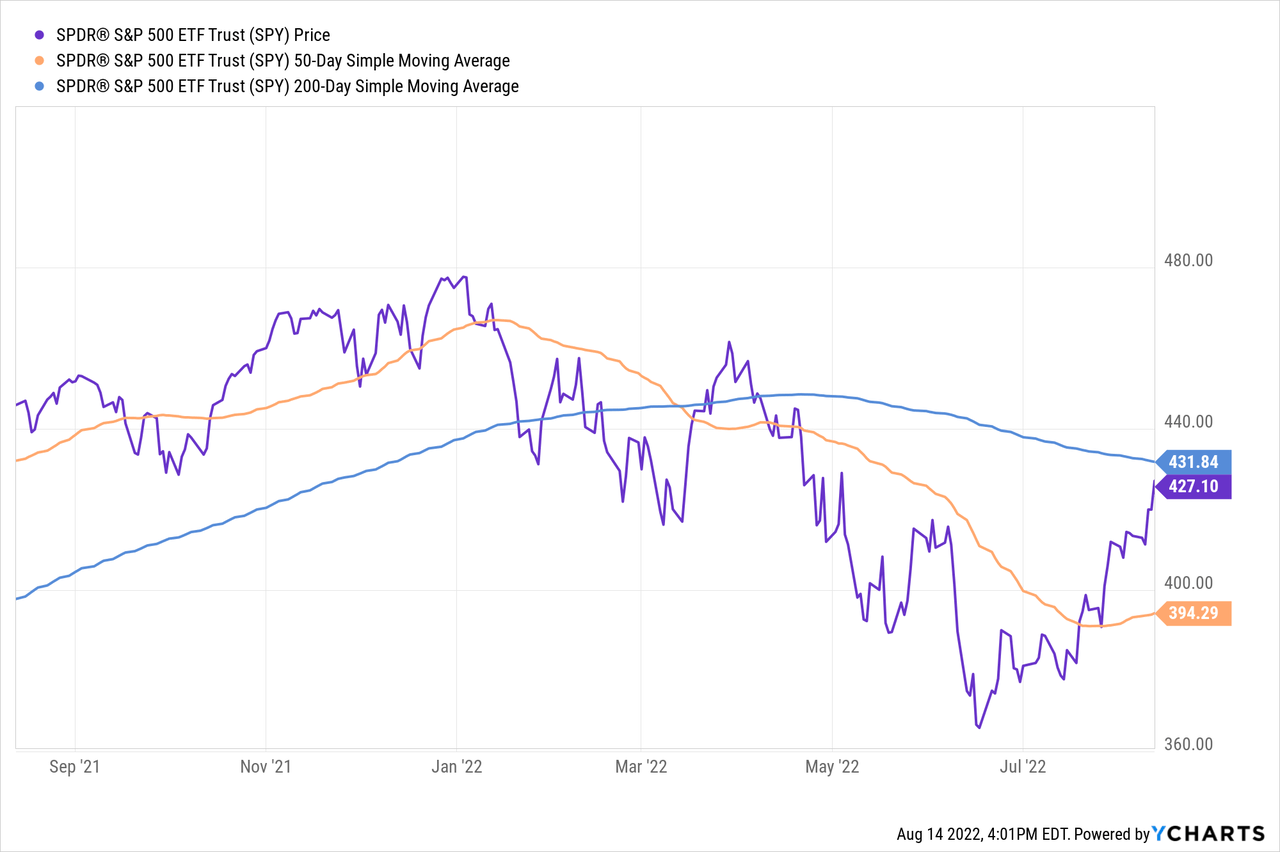
The S&P 500 did rally almost 18% from the June 17th bottom. Here is the 1-year SPY chart.
What’s coming next?
Whether the next Phase of the bear market happens depends on whether there is an imminent recession coming. The spread between the 10Y Treasury Bond and the 3-month T Bill is the Fed’s preferred indicator in estimating the 12-month recession probability.
I documented on June 23rd that the probability of a recession within the next 12 months is only 4% or very low. This was based on the fact that the 10y-3mo spread was still very wide.
However, since, the 10Y-3mo spread has significantly narrowed and reached the 0% level, currently sitting at 0.31%. Here is the chart of the 10y-3mo spread.

Thus, based on the significant narrowing of the 10y-3mo spread, the Fed’s probability of recession within next 12 months significantly increased to 17.6%. Note, historically, a recession generally occurred when the probability estimation exceeded the 30% level.
Thus, the Fed’s estimated recession probability is too high to ignore now. Further, we know that when the 10y-3mo spread inverts, the Fed’s recession probability will exceed the 30% level.
So, what’s coming next? Recession, and the Phase 2 of the full bear market. But when?
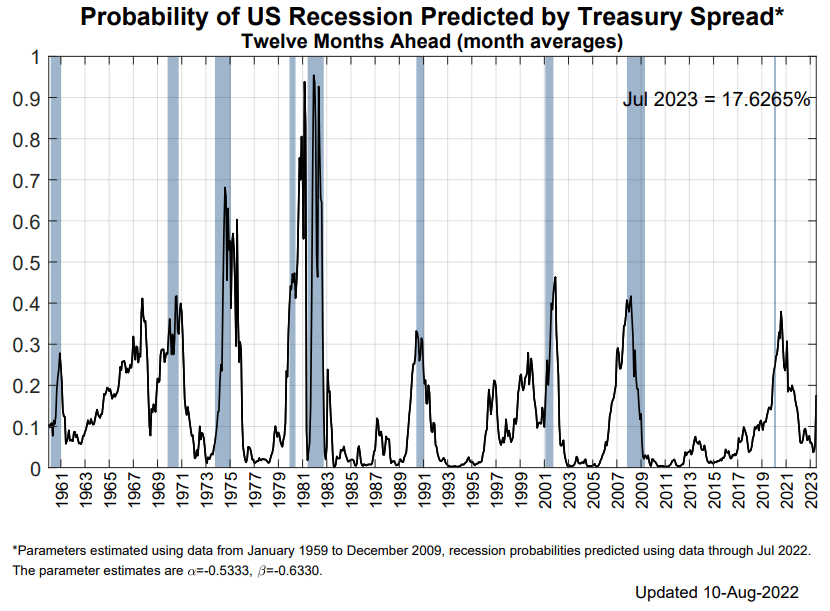
Here is the chart of the Fed’s probability of U.S. recession estimation, updated on Aug 10th 2022.
Timing the Phase 2 selloff
So, when can we expect the Phase 2 or an imminent recession selloff in S&P500. As previously stated, first we need to have an inversion of the 10y-3mo spread, which is currently at 0.31%.
Currently, the yield on a 10-year Treasury Bond is 2.83%, while the yield on 3-month T-bill, which is determined by the near term Federal Funds rate is 2.52%.
Based on the Federal Funds futures, the Fed is expected to hike to 2.95% by October 2022, which includes the FOMC meeting in September.
Thus, assuming that 10Y yields stay below 2.9%, the 10Y-3mo spread will invert sometimes in September. Well, this will boost the probability of a recession above the 30% level, and possibly trigger the Phase 2 of the bear market, or the next leg lower for SPY.
The Federal Funds futures are currently predicting that the Fed will hike to as high as 3.66% by April 2023. Unless long term rates spike higher, this would eventually produce a very deep 10y-3mo inversion and virtually guarantee a recession.
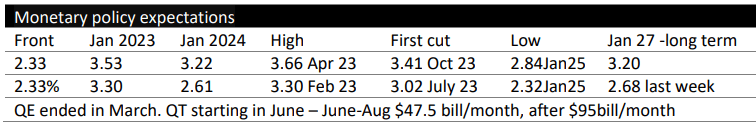
Here are the current Fed’s monetary policy expectations, based on the Federal Funds futures.
More bad news for September
These are the three negative triggers expected in September 2022:
- As previously explained, expect the inversion of the 10Y-3mo curve, and thus the significantly higher probability of a recession over the next 12 month.
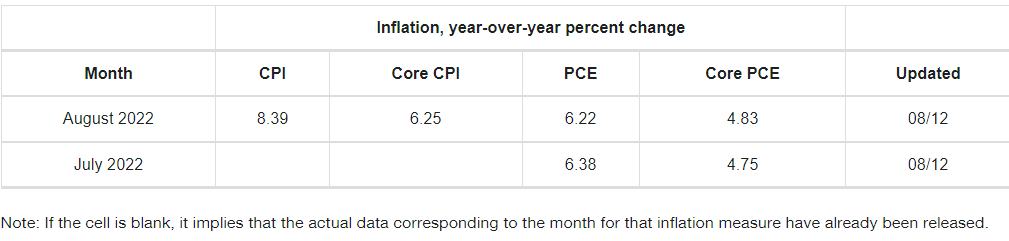
- At the same time, also expect a higher reading on core CPI for July, compared to June. Specifically, The Inflation Nowcast is currently predicting the July CPI to be 6.25%, well above the June print of 5.9%. This will force the Fed to keep the hawkish tone, despite the high recession probability.
- At the same time, despite the very high inflation probability, the Fed will double the QT from currently $47.5 bill/month to $95bill/month.
Here is the table with the CPI nowcast from Cleveland Fed.
Implications:
The S&P 500 had a large summer rally, which is hitting the key technical resistance. But more importantly, fundamentally, the recession probability will be much higher in September, as the 10y-3mo curve inverts, while the monetary policy tightening will increase, via QT and the interest rate hikes.
Thus, the Phase 2 of the full bear market is approaching. Tactically, this means taking profits of speculative long position, and starting to establish the tactical short positions.
Special note on SPY sectors
Over the last month, SPY is up by over 12%. However, the rally has been led by the cyclical Consumer Discretionary stocks (XLY) up over 20%, and Tech stocks (XLK) up over 16%.
Given the expectations of the virtually guaranteed recession, the SPY leadership is clearly unsustainable. This supports the thesis that the gains in these cyclical sectors will reverse and likely lead the SPY lower during the upcoming Phase 2 selloff.
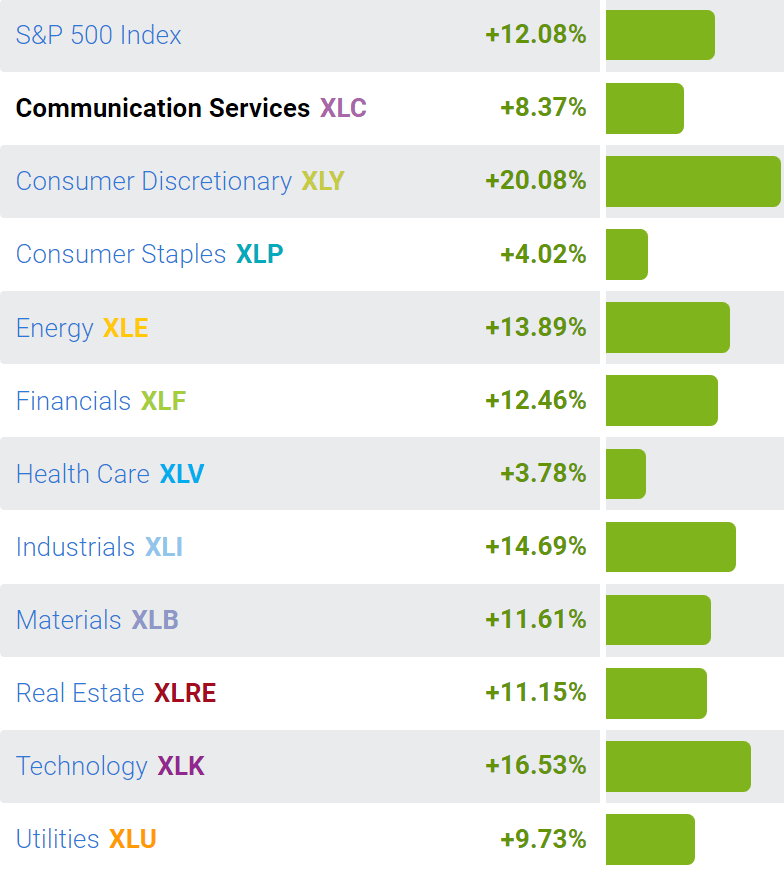
Photo by Markus Spiske on Unsplash