

Summary
- Dividend stocks are often categorized in superficial ways, primarily lumping together all higher yielding stocks as “high yield” and lower yielding stocks as “dividend growth.”
- There are many nuances. Some low-yielding stocks don’t show strong dividend growth, and some high-yielding stocks are fast growers that are temporarily marked down.
- I offer three categories of dividend stocks to use as a mental model when thinking through your own dividend investing.
Investors often categorize dividend stocks in terms of their yields – high yield, low yield, or moderate yield. But this categorization misses a lot of nuances.
Categorizing by dividend yield ignores the fundamentals of the underlying companies in favor of a superficial metric (dividend yield) that can fluctuate over time as companies go through different phases of growth and stagnation.
Likewise, the bifurcation of “dividend growth” and “high yield” can be misleading in a number of ways. A company with a strong record of high dividend growth can endure a temporary selloff, driving its dividend yield into “high yield” territory despite its ability to keep raising its payout at a rapid clip. Or a company can be awarded a high valuation and low dividend yield from the market for its multi-decade dividend growth track record, despite the fact that recent dividend growth has been very slow.
Take, for example, a well-known dividend stock that many a dividend investor has owned or at least considered owning: 3M (MMM). In the last decade, the Minnesotan industrial conglomerate has traded at dividend yields as low as around 2% and as high as 5%+.
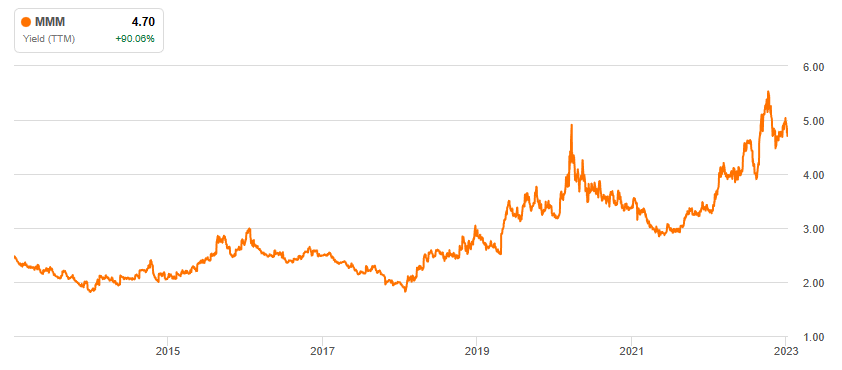
During that time period, MMM’s dividend growth rate has dropped from the double digits in the middle of the 2010s to a crawling, sub-1% pace in the last few years.
So, is MMM a high yield stock or a dividend growth stock?
Yes.
Of course, companies can go for a long time having a relatively low yield and then shift to having a relatively high yield for a while. That is allowed. But the point is that labeling a company based on its dividend yield alone does not come close to telling the full story of the fundamentals of the company. You can’t assume anything based on the level of yield in a vacuum.
To understand whether MMM is a former high growth company that now sports a high yield and low growth or a long-term high dividend growth company that is temporarily troubled and high-yielding, or some third option, you have to dive into the fundamentals.
Rather than categorizing dividend stocks by yield, I think investors would be much better served categorizing dividend stocks by the company’s estimated forward growth rate. (And here I mean the earnings growth rate.)
Using forward growth rates is more of an art than a science. Using current dividend yield or historical dividend growth rates to categorize stocks is relatively easy, and I see why many investors and index funds do it. But the problem is that these metrics on their own aren’t predictive of what will occur in the future.
To form a thesis about forward earnings growth, investors will need to put on their Sherlock Holmes hat and do some investigative work. Yes, that involves work, but that’s what individual stock-picking entails.
If you’d prefer to save yourself the hassle, there are plenty of ETFs available that use current dividend yield and historical dividend growth records to formulate baskets of stocks.
In what follows, I suggest a mental model categorizing dividend stocks into three separate buckets based on their estimated forward growth rates.
The Three Categories of Dividend Stocks
Admittedly, historical growth rates often portend what future growth rates will be. But not always. If one is going to own individual stocks, it is best to keep a sharp eye on those companies as a part-owner in a small business would keep an eye on the workings of the business. See the Sherlock Holmes comment above.
Sometimes the forward outlook is cloudy, even to management. But often, if you’ve done your homework and perhaps even succumbed to listening to an earnings call, you’ll be able to get a good idea of a company’s near-future growth outlook. Extrapolating from trends, the company’s particular positioning within those trends, and the company’s past ability to channel those trends into earnings growth, one gradually forms an idea of the range where future earnings growth will be.
And when I say “range,” I do mean range. I’m not advocating each investor calculate an exact forecast along the lines of: “3M’s earnings per share growth will average 5.34% over the next five years.” As part of their jobs, Wall Street analysts have to come up with precise earnings estimates and their historical accuracy is not far above zero. Maybe they’re broadly right, but they’re precisely wrong, so what’s the point in being precise?
No, precision isn’t the point. The point is to figure out a rough range into which a company’s forward earnings growth will likely fall. Based on the rough range one comes up with for forward earnings growth, here are the three categories of dividend stocks I suggest:
| Type of Dividend Stock | Average Annual Growth Rate |
| Fast Grower | 13%+ |
| Stalwart / Steady Compounder | 6-12% |
| Cash Cow | 1-5% |
Of course, it’s debatable where exactly to cut off each category and where one category bleeds into the other.
But broadly speaking, I believe these three categories provide a helpful mental model for investors to use in categorizing dividend stocks.
Let’s briefly examine each one.
1. Fast Grower
Fast Growers can be any size but are typically situated in some hot growth industry or trend. These companies, due to strong positioning within their hot industry or niche, are capable of generating at least mid-double-digit earnings and dividend growth for more than a few years in a row.
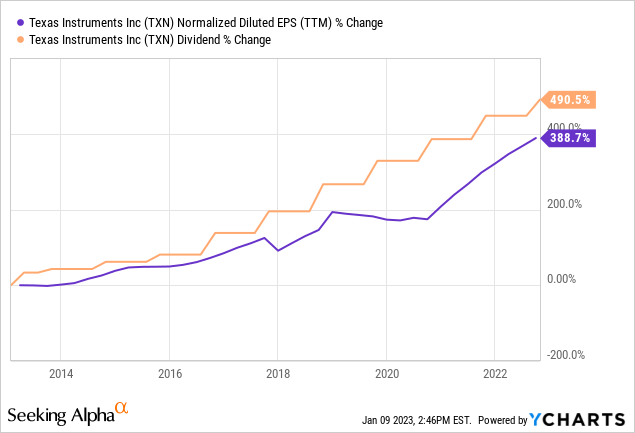
An obvious example of this is semiconductors. As everything becomes electronic and everything electronic uses more and more chips (case in point: cars), we will need more and more chips, benefiting the chipmakers. This goes for digital semiconductors, obviously, but also for the less sexy analog chips that are produced by the likes of Texas Instruments (TXN). Hence its strong growth rate:
Sometimes, though, the growth trend is somewhat hidden, such as in the case of Dollar General (DG) with dollar stores.
Look at the incredible growth rate of earnings and dividends over the past seven years:
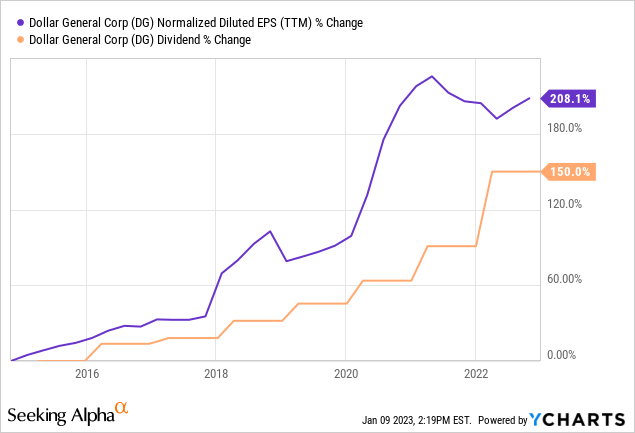
Who knew dollar stores would become so popular even in the midst of low-priced competition like Walmart (WMT), T.J. Maxx (TJX), and Ross Stores (ROST)? And who knew DG could expand into so many markets without cannibalizing its own sales?
Likewise consider the case of consultancy firm Booz Allen Hamilton (BAH), whose primary client is the US Government.
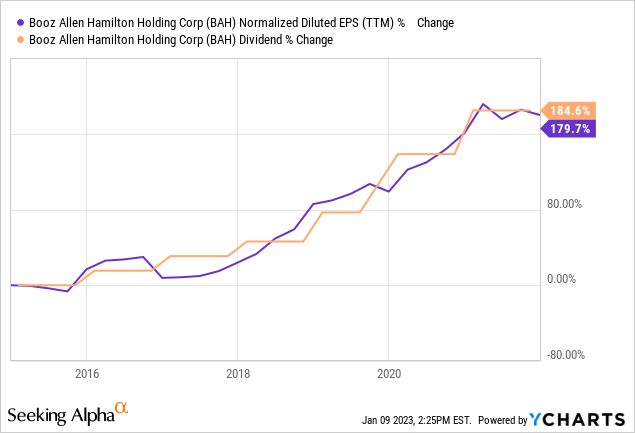
The federal government spends money like your ne’er-do-well Uncle Billy after he’s won $500 from a scratch-off lottery ticket. Only, the federal government can also borrow or print money ad infinitum. What better customer could a business have?
And then think about the many applications of technology and software automation, which information technology provider CDW Corporation (CDW) offers to clients in the public, private, and non-profit sectors. As technology advances, the need for IT services only grows.
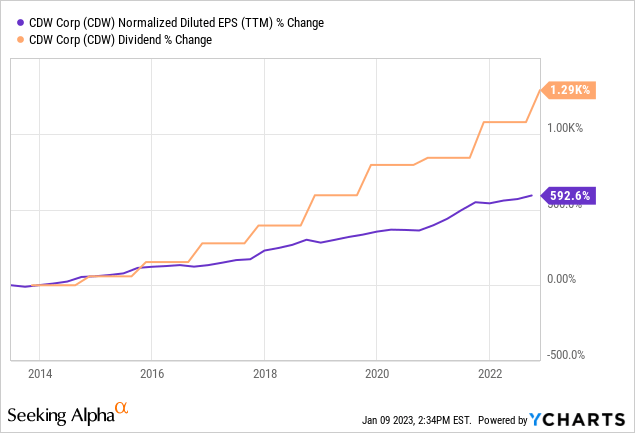
Why pay for your own IT department if you can save money by outsourcing it to CDW?
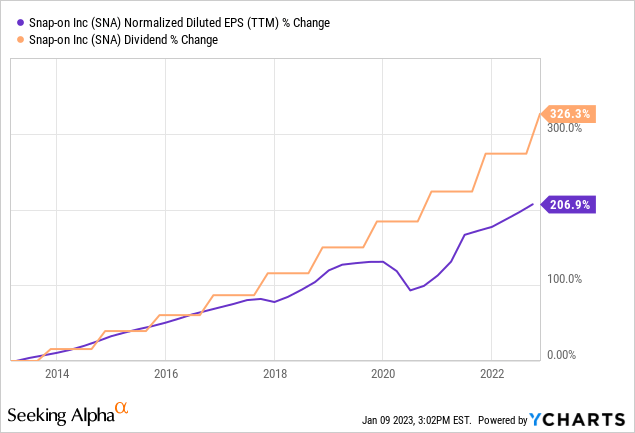
But there are exceptions to every rule. Sometimes Fast Growers aren’t in a growth industry at all but rather have found ways to extend attractive product offerings into adjacent categories and/or increase margins in order to generate sustained earnings growth. That is the case for toolmaker Snap-on (SNA), which has achieved very strong growth in the last decade.
Fast Growers are often found in the lower yielding dividend growth ETFs like Vanguard Dividend Appreciation ETF (VIG), iShares Core Dividend Growth ETF (DGRO), and Reality Shares DIVCON Leaders Dividend ETF (LEAD), although many of the names in these funds would be better defined as stalwarts.
What exactly is a stalwart? I’m so glad you asked.
2. Stalwart / Steady Compounder
The “Stalwart” or “Steady Compounder” category (I can’t decide whether I prefer one term or the other, so they both make the cut) are the strong, solid, established companies with proven business models that generate repeatable and growing returns year after year.
They typically aren’t very cyclical and don’t get clobbered during recessions. They are either big companies with strong brand & pricing power or small to mid-sized companies with a long runway of potential growth ahead of them.
Steady Compounders are my favorite category of dividend stocks to own, because they grow faster than Cash Cows and they typically don’t get quite as richly valued as Fast Growers.
Some of my favorites include:
- Agree Realty (ADC) – triple-net lease REIT focused on investment grade retailers well-positioned for the growth of omnichannel retail
- American Electric Power (AEP) – utility with service territories in some fast-growing Sunbelt areas such as my home state of Texas
- Alexandria Real Estate (ARE) – the leading life science REIT
- Bar Harbor Bankshares (BHB) – a small, well-run bank located in the fast-growing tourist town of Bar Harbor and expanding across the Northeast
- Crown Castle (CCI) – an exclusively U.S.-focused telecommunications infrastructure REIT well-positioned for 5G
- Mid-America Apartment Communities (MAA) – an owner/developer of mid-priced apartments in fast-growing Sunbelt markets

The Schwab U.S. Dividend Equity ETF (SCHD), Vanguard High Dividend Yield ETF (VYM), and iShares Core High Dividend ETF (HDV) are chock full of dividend stalwarts. Ignore the fact that the latter two have “high dividend” in their titles. They yield about the same as SCHD and hold many of the same 2.5% to 4% yielding names.
3. Cash Cow
The term “Cash Cow” refers, of course, to a dairy cow that regularly produces a valuable product (milk) while requiring very little maintenance and monitoring. When you’re done milking Bessy, just let her back into the field so she can graze on grass until it’s time to bring her back to the barn for milking again.
A Cash Cow stock is a company from which you don’t really expect much growth in earnings. You’re in it for that sweet stream of cash flow it generates. You can find them in any sector, but they can most often be found among REITs, utilities, telecommunications, business development companies (“BDCs”), and midstream oil & gas companies.
My friend Philip Eric Jones coined the acronym COW: “cash only wanted.” That’s a good description of what investors can and should expect from Cash Cows.
However, it is my personal preference to find Cash Cows that not only offer high yields but also raise their dividends by at least 2-3% per year in order to keep up with the long-term average level of inflation. That way, if you’re a retiree relying on this stream of income to fund living expenses, you won’t see the silent thief of inflation slowly whittle away the real purchasing power of your portfolio income over time.
Some of my favorite Cash Cows include:
- Capital Southwest (CSWC) – small and growing BDC based in Dallas, TX
- Enbridge (ENB) – Canadian midstream oil & gas giant with an LNG export terminal in development
- Enterprise Products Partners (EPD) – the highest quality and most conservatively managed US midstream energy company
- Main Street Capital (MAIN) – blue-chip BDC with a decade-long track record of growing both NAV per share and dividends
- Spirit Realty Capital (SRC) – well-run net lease REIT executing a capital recycling strategy
- Urstadt Biddle Properties (UBA) – New York tri-state area grocery-anchored retail REIT
- Verizon (VZ) – one of three corporations in the US telecom oligopoly with strong service quality and a head start in 5G
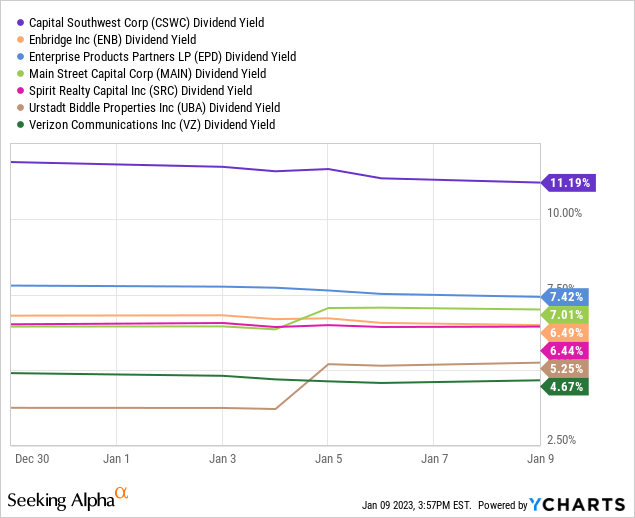
(I’m not sure why VZ’s dividend yield is shown above as being 4.67%. As of this writing, it is 6.3%.)
While there are some truly high yield equity ETFs, it is probable advisable to steer clear of these, because high yield includes not merely safe-but-boring slow-growers but also tanking companies on the verge of dividend cuts.
Categories Aren’t Permanent
It’s important to note that stocks do not go public with tags on top labeling them as always and forever one category or another. They can change categories, either slowly or quickly. Growth can slow down or speed up.
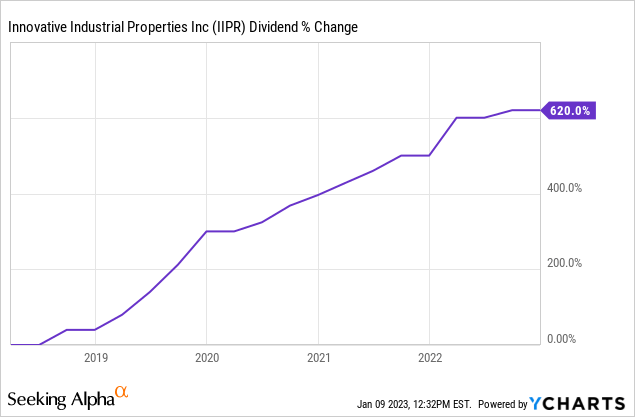
Let’s take the example of Innovative Industrial Properties (IIPR), the first and only pure-play cannabis equity REIT listed on an American exchange.
Beginning around 2018, the REIT garnered a high valuation from the market along with the corollary low cost of capital with which to issue cheap equity to scoop up the dozens of cannabis cultivation facilities being developed by fast-growing cannabis operators around the country. For years, it was one of the few real estate capital providers to cannabis companies, which gave it the leeway to obtain incredible lease terms such as mid-teens cap rates and 3% annual rent escalators. This setup allowed IIPR to raise its dividend at an incredible growth rate:
But today? IIPR is one of many real estate capital providers to cannabis operators, so it can’t get as good of lease terms anymore. And the spike in interest rates has pressured those same operators, slowing their own real estate footprint expansion and drying up their other sources of capital. This has caused IIPR’s stock price to drop as well since investors fear an industry-wide crash of some sort that causes massive disruption.
Hence IIPR’s 7%+ dividend yield, significantly narrowing the crucial investment spread between its cost of capital and acquisition cap rates.
With more competition, less sale-leaseback opportunities, and a higher cost of capital, IIPR looks like it has shifted from a Fast Grower to a Cash Cow.
Perhaps, if interest rates plummet back to much lower levels, IIPR could instead transition into a Stalwart by lowering its own cost of capital and also making the capital-raising environment more favorable for its tenants.
Usually, the lifecycle of a dividend stock goes Fast Grower > Stalwart > Cash Cow. There are exceptions, but that pattern is the general rule.
Bottom Line
I offer these three categories of dividend stocks as a mental model for investors to take and adjust as they see fit. Perhaps you think anything growing at less than 7% on an average annual basis is a “Cash Cow” and Fast Growers should show at least 15% annual growth. Fine by me.
Categorizing dividend stocks in this way is useful for multiple reasons:
- It can help you know what to expect from each stock and therefore what a good price/valuation to buy it would be
- It can help you understand why you hold certain stocks and whether they are fulfilling the purpose for which you bought them
- It can help you see how your own portfolio is weighted, whether towards Fast Growers, Stalwarts, or Cash Cows
As for me, my own portfolio is overwhelmingly weighted towards Stalwarts and Cash Cows. For the most part, that’s how I like it. That’s what I’m comfortable with.
But at the same time, I’m a younger investor and have a long investing horizon. I don’t need the cash right now. It all gets reinvested. So why not try to increase my exposure to Fast Growers?
One of my goals for 2023 is to increase the weighting of Fast Growers like Texas Instruments, Booz Allen Hamilton, and Snap-On, which I already own, and perhaps find a few others. I probably would not have formed this goal if I had not done the exercise of categorizing my stock portfolio into the three buckets outlined above.
Hopefully this can be as useful for you as it has been for me!