

Today we are living in uncertain times and with uncertainty brings volatile stock markets. The COVID-19 virus that has overtaken the globe and sent countries into pure panic mode. Over the course of the past four weeks or so, this panic has sent the S&P 500 from a high of $3,393 down to a low of $2,192, a decrease of 35%.
During times of panic we tend to see increased volume levels, which is exactly the case since late February as volume levels nearly tripled. The majority has been panic selling as many of us do not know what the global outcome for this pandemic will be. Economists from UCLA revised their US GDP estimates to negative growth of 6.5% and are projecting that a coronavirus-related recession will last into September. Other economists have estimated GDP in the US to fall 20% moving forward, and with shelter in place policies being implemented in the country’s two most populated states, New York and California, negative 20% GDP may be within reach.
What this has led to for long-term investors is a return of value investing, as many names that are well liked have been driven down by the pandemic. For those of you with long-term ambitions, this will be a blessing in disguise. For those of you closer to retirement, you will need to take a long, hard look at your portfolio and see where changes are needed to regain (slowly) what you have lost.
The biggest mistake one could make in times like this is trying to make all your losses back quickly. For starters, I fully expect volatility to remain until June, at the very least. What this means is you need to layer in your investments, which means making small tranche investments.
Being that I am in my mid-30s, I have a long-term plan. As such, I will be looking for companies with strong balance sheets that will be able to weather this short-term storm that is upon us. I will be looking to add some growth stocks, but as many of you already know, my focus tends to lean towards strong paying dividend stocks. In this piece today, we will discuss the dividend metrics that matter and how to identify those strong paying dividend companies.
Dividend Metrics That Matter
Dividends Per Share
Dividends are a way for companies to return earnings to shareholders. The company and their board of directors declare the dividends, usually on a quarterly basis for most companies, but some companies do monthly or even semi-annually.
Companies that are more established and have consistently growing cash flows tend to be the strongest dividend payers. Companies that are still in ultra-growth mode, such as Google (GOOGL) and or the likes of Amazon (AMZN) use their additional cash flows to reinvest back into the business as they are still growing at a strong clip.
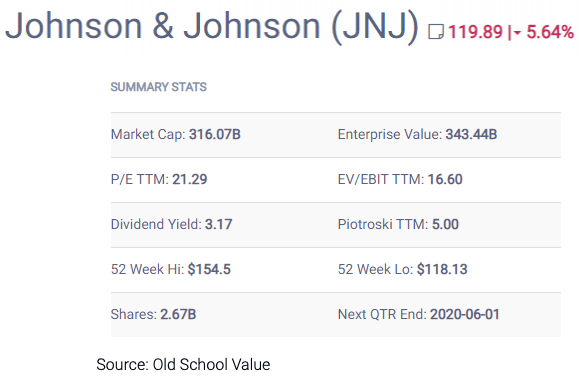
In the chart above, you can see Johnson & Johnson (JNJ) pays an annual dividend (distributed quarterly) that yields 3.17%, which amounts to $3.80 per share.
Dividend Yield
The dividend yield is what is used to compare companies to one another. The dividend yield is presented as a percentage and is calculated as follows:
Dividend Yield = Annual Dividend / Share price
The dividend yield represents the dividend an investor earns based on the current share price. Using the JNJ example above, with a $3.80 per share dividend and a current share price of $119.89, the company has a dividend yield of 3.17%.
If you were to compare the dividend of Realty Income Corp (O), which is one of the most popular REITs, and that of Realty Income, you would think JNJ pays you more. Realty Income pays an annual dividend of $2.80, which they elect to distribute monthly. However, when you look closer, Realty Income pays a much higher yield of 6.60%, which tells an investor they earn $6.6 for every $100 they invest compared to only $3.17 from JNJ.
Dividend yield is the easiest way to compare two companies’ dividends to one another.
Payout Ratio
The next dividend metric we will discuss is the payout ratio. The dividend payout ratio can be used by investors to determine how safe a dividend is. The ratio takes the total annual dividend per share paid out to shareholders relative to the earnings per share of the company. In other words, the payout ratio is the percentage of earnings paid to shareholders in the form of dividends.
Payout Ratio = Annual Dividends per share / Earnings Per Share
Let’s continue to use JNJ as our example. We know that the company currently pays an annual dividend of $3.80 and their trailing twelve-month (adjusted) EPS is $8.68, as such, JNJ has a current payout ratio of 44%.
As it currently stands, JNJ is using just 44% of their net income per share to pay their dividend leaving the remaining 56% to invest back into the business or paydown any debt. The payout ratio can easily determine if a company has room to grow their dividend in the future or if the dividend is at risk of pausing or even being cut. As a dividend investor, I rarely want to see my dividend cut.
Putting These Dividend Metrics Into Practice
Now that I have given a brief explanation of the important dividend metrics and how they are calculated, lets take a closer look at how we as investors can use them when performing our due diligence.
As a dividend growth investor, I do not focus merely on stocks that pay dividend, I want companies who consistently grow their dividends annually. The reason for this is not just because my dividend grows, but it puts into play the power of compounding dividends.
To fully grasp the power of compounding dividends, one must first understand the power of compounding. As the great Albert Einstein alluded to over 100 years ago:
The most powerful force in the world is compound interest” – Albert Einstein
The quote above has inspired many investors for years to put their money to work in reliable, income generating stocks, such as dividend growth stocks, and let them do the work. As dividends continue to accumulate through reinvestment, the snowball effect takes place.
Continuing on the use of Johnson & Johnson, let’s take a look at what we know so far.
- Stock Price: $119.89
- TTM Adj EPS: $8.68
- Annual Dividend: $3.80
- Dividend Yield: 3.17%
Over the course of the past five-years, Johnson & Johnson’s board has increased their dividend an average of 6.3% per year. A little valuation metric I like to look at is how the company’s current yield compares to their five-year average. Over the course of the past five-years, JNJ has had a dividend yield of 2.68%, which at their current rate of 3.17% tells me the stock appears undervalued.
Disclaimer: With the COVID-19 mess going on right now, you will find most stocks to appear undervalued when using this valuation view. The important piece is to determine those companies that will come out on top when this is all said and done.
Another way to utilize a company’s dividend yield is to compare it within its industry group. Other dividend stocks to compare JNJ to include: AbbVie Inc. (ABBV), Pfizer (PFE), and Merck & Co (MRK) among others. Refer to the “competitors” section to see other JNJ peers.
Investor Takeaway
Hopefully, by now you have a better understanding of the various dividend metrics and how they can be utilized when determining if a stock is undervalued or overvalued. Again, when it comes to investing in companies with growing dividends, the power of compounding dividends plays a large role in building wealth, yet it is often overlooked this day in age. Too many investors these days are too focused on a get-rich quick mentality, they fail to look long-term.
Photo by Dmitry Demidko on Unsplash